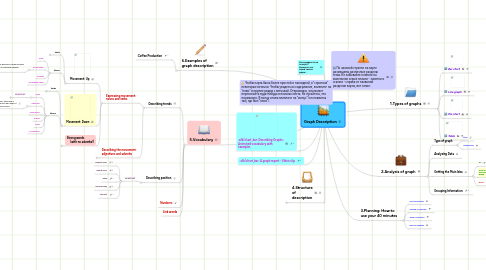
1. Чтобы карта была более простой и наглядной, я "спрятала" некоторые веточки. Чтобы увидеть их содержание, кликните на "плюс" в кружке рядом с веточкой. Открываясь, она может перескочить куда-нибудь в поисках места. Не пугайтесь, это нормально. В конце снова кликните на "минус" (он появится там, где был "плюс").
2. Describing Graphs: Animated vocabulary with examples
3. A graph report - Video clip
4. 5.Vocabulary
4.1. Describing trends
4.1.1. Expressing movement: nouns and verbs
4.1.1.1. Movement: Up
4.1.1.1.1. Verbs
4.1.1.1.2. Nouns
4.1.1.2. Movement: Down
4.1.1.2.1. Verbs
4.1.1.2.2. Nouns
4.1.1.3. Strong words (with no adverbs!)
4.1.1.3.1. soar (up)
4.1.1.3.2. shoot up
4.1.1.3.3. surge
4.1.1.3.4. rocket
4.1.1.3.5. boom
4.1.1.3.6. crash
4.1.1.3.7. plummet
4.1.1.3.8. plunge
4.1.1.3.9. collapse
4.1.1.3.10. slump
4.1.2. Describing the movement: adjectives and adverbs
4.1.2.1. Adjectives
4.1.2.1.1. Examples
4.1.2.2. Adverbs
4.1.2.2.1. moderately
4.1.2.2.2. slightly
4.1.2.2.3. minimally
4.1.2.2.4. slowly
4.1.2.2.5. steadily
4.1.2.2.6. gradually
4.1.2.2.7. dramatically
4.1.2.2.8. sharply
4.1.2.2.9. steeply
4.1.2.2.10. substantially
4.1.2.2.11. significantly
4.1.2.2.12. rapidly
4.1.2.2.13. suddenly
4.1.2.2.14. quickly
4.1.2.2.15. considerably
4.1.2.2.16. markedly
4.1.2.2.17. swiftly
4.1.2.2.18. Notably
4.2. Describing position
4.2.1. EXAMPLES
4.2.1.1. highest level
4.2.1.2. lowest level
4.2.1.3. peak
4.2.1.4. reach a peak
4.2.1.5. stand at
4.3. Numbers
4.4. Link words
5. 4.Structure of description
5.1. You should use 3 parts:
5.1.1. Part 1: the introduction
5.1.2. Part 2: the body
5.1.3. Part 3: the conclusion
5.2. Step 1
5.3. Step 2
5.4. Step 3
5.5. Step 4
5.6. Step 5
5.7. Step 6
6. 6.Examples of graph description
6.1. Coffee Production
7. Как передвигаться по карте? Кликните этот серый значок рядом -
8. По часовой стрелке на карте размещены различные разделы темы. Не забывайте кликать на маленькие серые значки - заметки и ссылки - справа от названий разделов карты, вот такие:
9. 1.Types of graphs
9.1. Bar chart
9.2. Line graph
9.3. Pie chart
9.4. Table
10. 3.Planning: How to use your 40 minutes
10.1. First 10 minutes
10.2. Second 10 minutes
10.3. Third 10 minutes
10.4. Final 10 minutes
11. 2.Analysis of graph
11.1. Type of graph
11.1.1. time
11.1.2. comparison
11.2. Analysing Data
11.3. Getting the Main Idea
11.3.1. Do
11.3.2. Click to see some of the MAIN IDEAS in the graph
11.3.3. Don't
