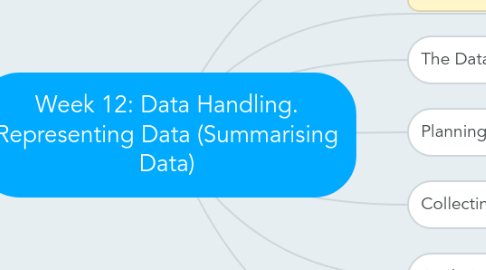
1. Key Topics are in Red
2. Key Concepts are in Yellow
3. The Data Handling Process
3.1. .
4. Planning Data Collection
4.1. Important concepts
4.1.1. Hypothesis
4.1.1.1. .
4.1.2. Population
4.1.3. Sample
4.1.3.1. -
4.1.3.1.1. Multiple ways of 'sampling'
4.1.4. Bias
5. Collecting Data
5.1. Experimental Design
5.1.1. -
5.1.1.1. Reliable
5.1.1.2. Valid
5.2. Recording Data
5.2.1. Raw data
5.2.1.1. Data Tables
5.2.1.1.1. Need to manipulat for meaning
6. Analysing Data
6.1. Univariate Data
6.1.1. Examples are
6.1.1.1. Height of students enrolled at UTas
6.1.1.2. Length of worms in a soil sample
6.1.1.3. Number of cars manufactured in a particular year
6.1.1.4. Number of people born in a particular year
6.1.2. We look at two main things
6.1.2.1. Central Tendency
6.1.2.1.1. Mean
6.1.2.1.2. Median
6.1.2.1.3. Mode
6.1.2.1.4. +
6.1.2.2. Range
6.1.2.2.1. Max score-Min score
6.1.3. Arranging Data
6.1.3.1. -
6.1.3.1.1. Representing Data
6.1.3.1.2. Displaying Data (Next Lecture)
6.1.4. Data can be further categorised
6.1.4.1. Qualitative Data
6.1.4.2. Quantitative Data
6.1.4.3. Continuous Data
6.1.4.4. Discrete Data
6.1.4.5. Primary Data
6.1.4.6. Secondary Data
6.1.4.7. Protocol
7. Your Turn
7.1. .
7.1.1. .
