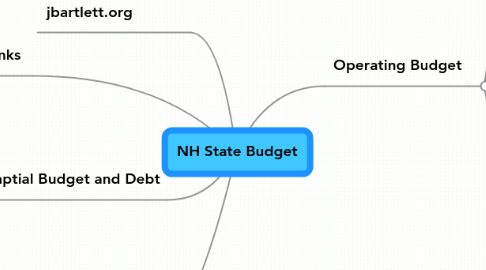
1. Captial Budget and Debt
1.1. $239 M
1.2. General Fund Debt
1.3. General Obligation Debt
1.4. Self Supporting Debt
1.4.1. Turnpike debt
1.5. Debt Issued offset by Debt Retired
1.6. Growth: $644M to $822M
1.6.1. +28% / 4yr
1.6.2. Usually very static
2. Slides available on jbartlett.org
3. Spending Trends
3.1. Over 20 years
3.1.1. General Funds - 4.5%
3.1.2. Biennial increase avg. 8.7%
3.1.3. Inflation adjusted - 2.6%
3.2. 10 yr
3.2.1. GF + ETF 10 yr avg - 2.55%
3.3. 1989 adjusted - 1.025 B
4. links
4.1. http://admin.state.nh.us/accounting/reports.asp
4.1.1. Monthly REvenue and Historical
4.2. http://www.gencourt.state.nh.us/lba/indexbudget.html
4.2.1. Budget Document (LBA)
4.3. http://www.nh.gov/treasury/Divisions/DM/DMdocs.htm
4.3.1. Go here and find the bond statement
4.3.2. Last half of the last page is the most concise list of state spending - all 6 categories
5. Operating Budget
5.1. July 1st new year
5.2. Federal Funds
5.3. Tax Revenues
5.3.1. General Fund
5.3.1.1. Discussion of surplus / shortfalls occur here
5.3.1.2. Diverse basket of taxes
5.3.1.2.1. 10 sources is 81%
5.3.1.2.2. More stable then national economy
5.3.1.3. Taxes
5.3.1.3.1. Business Taxs
5.3.1.3.2. Tobacco - $244 - 13%
5.3.1.3.3. Meals and Rooms - $232 - 12.5%
5.3.1.3.4. Liquor - $120 - 6.5
5.3.1.3.5. I & D - $84.5 - 4.5%
5.3.1.3.6. Real Estate Transfer - $84.5 - 4.5%
5.3.1.3.7. Communications - $80 - 4.3%
5.3.1.3.8. Insurance - $87
5.3.1.3.9. Lottery - $66
5.3.1.3.10. Medicade Enhancement - $118
5.3.1.3.11. Other
5.3.2. Education Fund
5.3.2.1. Money is sent back to towns
5.3.2.2. Response to Claremont case
5.3.2.2.1. "public adequecy plan"
5.3.2.2.2. name changes ~2 yrs
5.3.2.3. Transparency w/r/t tax increases for this Fund
5.3.2.4. This is NOT a trust fund like other states
5.3.2.4.1. Not balanced seperately, but as a line item of the general fund
5.4. By Fund
5.4.1. 2 yr numbers given
5.4.2. General Fund
5.4.2.1. $3.2 B
5.4.3. Federal Funds
5.4.3.1. $3.7B
5.4.4. Education Fund
5.4.4.1. New node
5.4.5. Other "Other Funds"
5.4.5.1. $1.9 B
5.4.5.1.1. The new Education Trust Fund
5.4.6. Fish and Game
5.4.7. Transportation
5.5. Funds must be balanced
5.5.1. RSA 9:8
5.5.2. Biennium
5.5.3. Estimated revenue
5.5.4. Money remaining from propr biennium
5.5.5. Bonding (debt) prohibited for "operating expenditures"
5.6. Spending
5.6.1. General Government
5.6.1.1. $555 M
5.6.2. Justice
5.6.2.1. $691 M
5.6.3. Resources
5.6.3.1. $344 M
5.6.4. Transportation
5.6.4.1. $566 M
5.6.5. Health and Social
5.6.5.1. 2087 M
5.6.6. Education
5.6.6.1. 1502 M
5.7. Employee Costs
5.7.1. 12,000 state employees @ 45,800
5.7.2. Wages approx. $600 M in wages
5.7.3. Benefits approx $250 M
5.7.4. Retirement approx $50 M
5.7.5. $900 M = 15% of annual costs
5.8. Local Aide
5.8.1. 2009
5.8.1.1. Education
5.8.1.1.1. $1.017 B
5.8.1.2. Municipal
5.8.1.2.1. $125 M
5.8.2. 2010
5.8.2.1. Education
5.8.2.1.1. $1.026 B
5.8.2.2. Municipal
5.8.2.2.1. $93 M
5.8.3. Combined is 45% of Operating Budget
