Statistics
by Mary Hesler
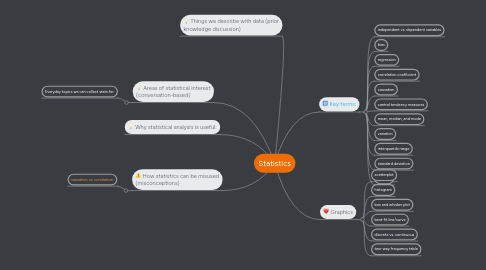
1. Things we describe with data (prior knowledge discussion)
2. How statistics can be misused (misconceptions)
2.1. causation vs. correlation:
3. Areas of statistical interest (conversation-based)
3.1. Everyday topics we can collect stats for:
4. Why statistical analysis is useful:
5. Key terms:
5.1. independent vs. dependent variables
5.2. bias
5.3. regression
5.4. correlation coefficient
5.5. causation
5.6. central tendency measures
5.7. mean, median, and mode
5.8. variation
5.9. interquartile range
5.10. standard deviation
5.11. outliers
6. Graphics
6.1. scatterplot
6.2. histogram
6.3. box and whisker plot
6.4. best-fit line/curve
6.5. discrete vs. continuous
6.6. two-way frequency table

