

1. Notation
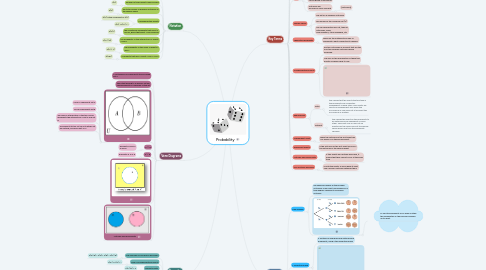
1.1. Probability of an event X
1.1.1. P(X) where X represents the event
1.2. number of times event X has occured
1.2.1. n(X)
1.3. the total number of possible outcomes in the sample space
1.3.1. n(U)
1.4. Complementary events
1.4.1. P(X') is the compliemt of P(X)
1.4.2. P(X) + P(X') = 1
1.5. the conditional probability that event X occurs, given that event Y has occurred
1.5.1. P(X|Y)
1.6. the probability of the intersection of events X and Y
1.6.1. P(A ∩ B)
1.7. the probability of the union of events X and Y.
1.7.1. P(X ∪ Y)
1.8. Probability that BOTH event X and Y occur
1.8.1. P(X&Y)
2. Venn Diagrams
2.1. A rectangular box represents the enclosed set U.
2.2. Items that belong to a specific set are called Elements or Members of the set
2.3. .
2.3.1. Circle A represents set A
2.3.2. Circle B represents set B
2.3.3. The area of intersection of the two circles represents the intersection of set A and set B
2.3.4. All elements tht do not fall into either set are outside, and are a part of U
2.4. A ∩ B
2.4.1. Elements in BOTH A and B
2.5. A ∪ B
2.5.1. Elements in A or B
2.6. .
2.7. Mutually exclusive events
3. Formulas
3.1. The Principle of Inclusion & Exclusion
3.1.1. P(A∪B) = P(A) + P(B) – P(A∩B)
3.2. Rule of Complementary Events
3.2.1. P(A’) + P(A) = 1
3.3. Disjoint Events
3.3.1. P(A∩B) = 0
3.4. Independent Events
3.4.1. P(A∩B) = P(A) ⋅ P(B)
3.5. Conditional Probability
3.5.1. P(A | B) = P(A∩B) / P(B)
3.6. Bayes Formula
3.6.1. P(A | B) = P(B | A) ⋅ P(A) / P(B)
4. Key Terms
4.1. Probability
4.1.1. is the mathematics of chance or likelihood.
4.1.2. We observe probabilities from the occurrences of previous events or experiments and make predictions based on the observervations
4.1.3. Probability can ONLY suggest what MIGHT happen, as suppose to delivering an accurate result every
4.1.4. The probability of an event is the ratio of the number of ways the event can occur TO the total number of outcomes.
4.1.5. can be expressed as a fraction, decimal or a percentage.
4.1.6. Probability ranges from 0 (an impossible event with a 0% chance) to 1 (100% certainty).
4.2. Trial
4.2.1. one repetition of an experiment or simulation.
4.3. Outcome
4.3.1. a possible result of a trial in a simulation.
4.4. Event
4.4.1. a specific, desired outcome in a simulation
4.4.2. can be single outcome
4.4.3. can be group of outcomes
4.4.4. outcomes are enclosed in curly brackets
4.4.4.1. {outcomes}
4.5. Sample Space
4.5.1. The set of all possible outcomes
4.5.2. also known as the Universal Set (U)
4.5.3. Can be represented as a list, table of outcomes, a grid, Tree Diagrams, Venn Diagraphs, etc
4.6. Theoretical probability
4.6.1. based on the mathematical laws of probability; what is expected to happen.
4.7. Complementary Events
4.7.1. are two outcomes of an event that are the only two possible outcomes being observed.
4.7.2. The sum of the probabilities of these two events is always equal to one.
4.7.3. .
4.8. Replacement
4.8.1. With
4.8.1.1. this implies that the events that are take in the probability are completely independent of each other. Two events are said to be independent only when the occurrence of one does not at all affect the occurrence of another
4.8.2. Without
4.8.2.1. this implies the events in the probability to be determined are dependent on each other. The event may or may not be affected as the cases vary but the sample space differs and thus the probability changes.
4.9. Independant event
4.9.1. when the outcome of the first event has NO AFFECT on the second event
4.10. Dependant events
4.10.1. if the outcome of the first event AFFECTS the outcome of the second event
4.11. Mutually Exclusive Events
4.11.1. If two events are mutually exclusive, it means that they cannot occur at the same time
4.12. Non mutually exclusive
4.12.1. if both the events A and B have at least one common outcome between them
5. Concepts
5.1. Tree diagram
5.1.1. ree diagrams display all the possible outcomes of an event. Each branch in a tree diagram represents a possible outcome
5.1.2. .
5.1.2.1. To find the probability of an even multiply the probabilites on the branches leading up to result
5.2. 2 Dimentional grid
5.2.1. A method of displaying and determinfing probability, using a two dimentional grid
5.2.2. .
5.3. Table of outcomes
5.3.1. a table where the first row and first column represent the possible outcomes in each event.
5.3.2. .
5.3.3. .