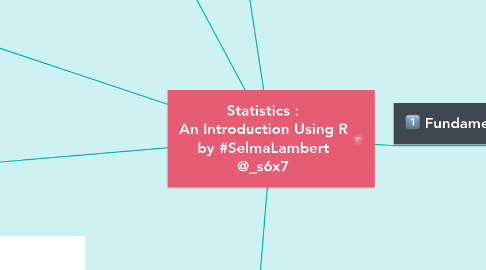
Statistics : An Introduction Using R by #SelmaLambert @_s6x7
저자: Selma LAMBERT月亮

1. Dataframes
1.1. Selecting Parts of a Dataframe: Subscripts Sorting Summarizing the Content of Dataframes Summarizing by Explanatory Variables First Things First: Get to Know Your Data Relationships Looking for Interactions between Continuous Variables Graphics to Help with Multiple Regression Interactions Involving Categorical Variables Further Reading
2. Central Tendency
2.1. Arithmetic mean Median Geometric mean Log geometric mean Harmonic mean
3. Variance
3.1. Degrees of Freedom Variance Variance and Sample Size A Measure of Unreliability Confidence Intervals Bootstrap
4. Single Samples
4.1. Data Summary in the One Sample Case The Normal Distribution Calculations using z of the Normal Distribution Plots for Testing Normality of Single Samples Inference in the One-sample Case Bootstrap in Hypothesis Testing with Single Samples Student’s t-distribution Higher-order Moments of a Distribution Skew Kurtosis
5. Two Samples
5.1. Comparing Two Variances Comparing Two Means Student’s t-test Wilcoxon Rank Sum Test Tests on Paired Samples The Sign Test Binomial Tests to Compare Two Proportions Chi-square Contingency Tables Fisher’s Exact Test Correlation and Covariance Data Dredging Partial Correlation Correlation and the Variance of Differences Between Variables Scale-dependent Correlations Kolmogorov-Smirnov Test
6. Fundamentals
6.1. About R Everything Varies Significance Good and Bad Hypotheses Null Hypotheses p Values Interpretation Statistical Modelling Maximum Likelihood Experimental Design The Principle of Parsimony (Occam’s Razor) Observation, Theory and Experiment Controls Replication: It’s the n’s that Justify the Means How Many Replicates? Power Randomization Strong Inference Weak Inference How Long to Go On? Pseudoreplication Initial Conditions Orthogonal Designs and Non-orthogonal Observational DataAbout R Everything Varies Significance Good and Bad Hypotheses Null Hypotheses p Values Interpretation Statistical Modelling Maximum Likelihood Experimental Design The Principle of Parsimony (Occam’s Razor) Observation, Theory and Experiment Controls Replication: It’s the n’s that Justify the Means How Many Replicates? Power Randomization Strong Inference Weak Inference How Long to Go On? Pseudoreplication Initial Conditions Orthogonal Designs and Non-orthogonal Observational Data


