
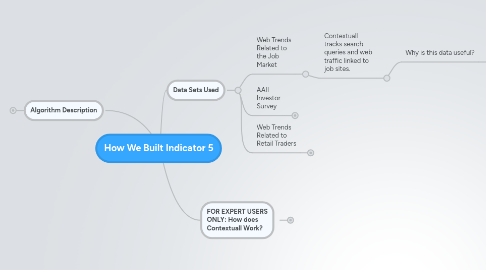
1. Algorithm Description
1.1. We used a neural network
1.1.1. Click the link for a description
2. FOR EXPERT USERS ONLY: How does Contextuall Work?
2.1. Contextuall collects a wide range of unique data---everything from Twitter feeds, Facebook data, web site traffic trends and economic data releases.
2.1.1. How are these data points turned into trading indicators?
2.1.1.1. We use cutting-edge machine learning technologies to identify predictive variables, and turn them into trading indicators that perform well during a backtest. For more info, click on the link...
2.1.2. How do you know these data points are useful?
2.1.2.1. We use statistical procedures to filter our data points, isolating variables that show predictive potential...For more information on this process, click on the link.
3. Data Sets Used
3.1. Web Trends Related to the Job Market
3.1.1. Contextuall tracks search queries and web traffic linked to job sites.
3.1.1.1. Why is this data useful?
3.1.1.1.1. The assumption here is that companies would often post their jobs online before starting with the interview process, meaning that online job trends can often be interpreted as a leading indicator of the overall job market.
3.2. AAII Investor Survey
3.2.1. Contextuall tracks the investor survey conducted by the American Association of Individual Investors.
3.2.1.1. How data is collected
3.2.1.1.1. The survey measures the percentage of individual investors who are bullish, bearish, and neutral on the stock market for the next six months; individuals are polled from the ranks of the AAII membership on a weekly basis. Only one vote per member is accepted in each weekly voting period.
3.2.1.2. Why the data is useful
3.2.1.2.1. The sentiment of retail investors (the general public), is often seen as a good contrarian indicator. In other words, if everyone is negative about the stock market, it could be a good time to buy, and vica versa.
3.3. Web Trends Related to Retail Traders
3.3.1. Contextuall tracks web traffic trends to online brokerages and financial newsletters, and also monitors online popularity of stock pickers like Jim Cramer.
3.3.1.1. Why is this data useful?
3.3.1.1.1. Rising enthusiasm among retail investors is often seen as a contrarian indicator.