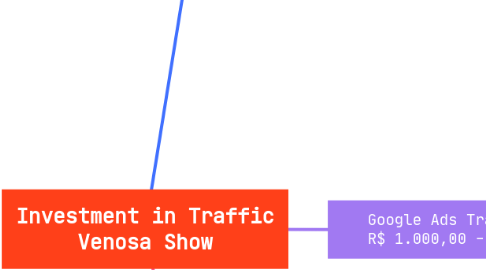
1. Project Review
1.1. Projeto Venosa Show
1.2. Timeline: 30 dias
1.3. Budget R$ 2.700,00
1.4. Daily Cost: R$ 90,00
2. Meta Ads Traffic R$ 1.000 - 37%
2.1. Campaing
2.1.1. Ad Group
2.1.1.1. Announcement
2.1.1.1.1. Instagram
2.1.1.1.2. Group 01
2.1.1.1.3. Facebook
2.1.1.1.4. Group 02
2.1.1.1.5. Whatsapp
2.1.1.1.6. Group 03
2.1.1.1.7. Branding
2.1.1.1.8. Group 04
2.2. Challenges:
2.2.1. precise targeting
2.2.1.1. Persona
2.2.1.1.1. Conversion
2.3. Other Insights:
2.3.1. CTR
2.3.2. Cick
2.3.3. CPM
2.3.4. CPC
2.3.5. Preview
3. Google Ads Traffic R$ 1.000,00 - 37%
3.1. research network
3.1.1. Ad Group
3.1.1.1. Keywords
3.1.1.2. Segmentation
3.1.1.2.1. Announcement
3.1.1.2.2. Extensions
3.1.1.2.3. Call to Action
3.1.1.3. Location
3.1.1.3.1. navegation
3.2. You Tube
3.2.1. Ad Group
3.2.1.1. Keywords
3.2.1.2. Segmentation
3.2.1.2.1. Announcement
3.2.1.2.2. Extensions
3.2.1.3. Location
3.2.1.3.1. navegation
3.3. Display
3.3.1. Ad Group
3.3.1.1. Keywords
3.3.1.2. Segmentation
3.3.1.2.1. Announcement
3.3.1.2.2. Landing Page
3.4. Other Insights:
3.4.1. CTR
3.4.2. Click
3.4.3. CPC
3.4.4. Page Duration
3.4.5. Preview
4. Tik Tok Traffic R$ 700,00 - 26%
4.1. Campaing
4.1.1. Ad Group
4.1.1.1. segmentation
4.1.1.1.1. Announcement
4.1.1.2. Loacation
4.1.1.2.1. Direction
4.1.1.3. Extensions
4.1.1.3.1. Copy
4.1.2. Other Insights:
4.1.2.1. Preview
4.1.2.2. Click
4.1.2.3. CTR
4.1.2.4. Time Duration
