
1. Cumulative sales time comparison analysis
1.1. Often it is more interesting to analyse sales over time on a cumulative basis
1.1.1. We can start with our base sales measures with time intelligence
1.1.1.1. Total Sales = SUM( Sales[Total Revenue] )
1.1.1.2. Sales Last Quarter = CALCULATE( [Total Sales], DATEADD( Dates[Date], -1, QUARTER ) )
1.1.1.3. Sales Last Year = CALCULATE( [Total Sales], DATEADD( Dates[Date], -1, YEAR ) )
1.1.2. The we get the cumulative versions of each by using CALCULATE with FILTER and ALLSELECTED
1.1.2.1. Cumulative Total Sales = CALCULATE( [Total Sales], FILTER( ALLSELECTED( 'Dates' ), Dates[Date] <= MAX(Dates[Date]) ) )
1.1.2.2. Cumulative Total Sales LQ = CALCULATE( [Sales Last Quarter], FILTER( ALLSELECTED( 'Dates' ), Dates[Date] <= MAX(Dates[Date]) ) )
1.1.2.3. Cumulative Total Sales LY = CALCULATE( [Sales Last Year], FILTER( ALLSELECTED( 'Dates' ), Dates[Date] <= MAX(Dates[Date]) ) )
1.1.2.4. ALLSELECTED is a highly complex DAX function that we must use with caution
1.1.2.4.1. It is similar to ALL but we use it in scenarios where we want to break current filter context in a visual but ***keep*** filters placed on slicers and selections made outside of that visual
1.1.2.4.2. It is safe to use as part of filter argument inside calculate
1.1.2.4.3. We should ***avoid*** using ALLSELECTED as a table function, for example as the argument for COUNTROWS, and we should avoid nesting it inside iterating functions like SUMX
1.1.3. To go futher and focus on the difference between current cumulative sales and cumulative sales last year, we can create a diff measure
1.1.3.1. Cumulative Sales Diff = [Cumulative Total Sales] - [Cumulative Total Sales LY]
1.1.4. When we bring these together in a report, we can create a highly dynamic analysis of sales over time
1.1.4.1. Q3 2021 cumulative sales, top 5 cities
1.1.4.2. Q2 2021 cumulative sales in Auckland
2. Advanced counting with COUNTROWS
2.1. Imagine a simple starting point with this measure:
2.1.1. Total Transactions = COUNTROWS( Sales )
2.2. We can see it in reporting context:
2.2.1. Number of transactions per day for Q3 2021
2.3. Now imagine that we want to compare this [Total Transactions] per day measure with total transactions for only the top 5 selling products
2.3.1. We need a top 5 ranking of product sales across the whole of time and then we want to count the 'Sales' table rows per day only after it's been filtered to these 5 products
2.3.2. Here is the measure to achieve this, with some explanation to follow:
2.3.2.1. Total Transactions Top 5 Products = COUNTROWS( CALCULATETABLE( 'Sales', TOPN( 5, ALL( 'Products' ), CALCULATE( [Total Sales], ALL( 'Dates' ) ), DESC ) ) )
2.3.2.1.1. COUNTROWS needs a table, but we can't simply count 'Sales' because we need to alter the filter context for these top 5 products
2.3.2.1.2. To alter the filter context of the CALCULATETABLE on the 'Sales' table, we use the TOPN function
3. Budget allocation algorithm
3.1. Let's start by imagining the following budget scenario: we have annual budgets per city and daily sales (actuals), and we want to compare daily sales to budget
3.1.1. The City Budgets fact table has no physical relationships in our model due to it's yearly date grain
3.1.2. We overcome the lack of relationships when creating the [Regional Budget] measure by using TREATAS to create virtual relationships
3.1.2.1. Regional Budget = VAR CityLink = TREATAS( VALUES( 'Regions'[City] ), 'City Budgets'[City] ) VAR YearLink = TREATAS( VALUES( 'Dates'[Year] ), 'City Budgets'[Year] ) RETURN CALCULATE( [Total Budget], CityLink, YearLink )
3.1.2.1.1. Total Budget = SUM( 'City Budgets'[Sales Budgets] )
3.1.3. However, when we add [Regional Budget] alongside [Total Sales] in a daily context, we just get the total budget for all cities and all time repeating
3.1.3.1. We can add City as a slicer, which enables us to slice [Regional Budget] by region but still we are getting the budget for the whole year repeating every day
3.2. Now let's break down how to convert this annual budget number into a daily budget allocation
3.2.1. The algorithm is:
3.2.1.1. 1 / {days in year} * [Regional Budget]
3.2.2. Here is how we define this algorithm in DAX, making use of COUNTROWS, CALCULATE, ALL and VALUES
3.2.2.1. Daily Regional Budget = VAR DaysInContext = COUNTROWS('Dates') VAR DaysInYear = CALCULATE( COUNTROWS( 'Dates' ), ALL( 'Dates' ), VALUES( 'Dates'[Year] ) ) RETURN DIVIDE( DaysInContext, DaysInYear, 0) * [Regional Budget]
3.2.2.1.1. COUNTROWS will return 1 for the DaysInContext variable for every row of our table visual thanks to the Date context
3.2.2.1.2. To get DaysInYear, we must use the trick of breaking out of the 'Dates' filter context entirely using the ALL function and then bring back just the 'Dates'[Year] context via the VALUES function, all wrapped in CALCULATE of course
3.2.2.1.3. Finally, we utilise the DIVIDE function for more elegant (safe) division and multiply by the the [Regional Budget] measure to complete our algorithm
3.2.2.2. Here is the result in the table
3.2.2.2.1. Now we have a dynamic report that allows us to visualise how are sales went according to budget
4. Fixing incorrect totals in table visuals
4.1. This is a common issue, where you add some measure to a table visual that generally seems to work but produces an incorrect value in the totals row at the bottom
4.1.1. As an example, let's imagine we want the minimum values between two related measures: [Total Sales] and [Sales Last Year]
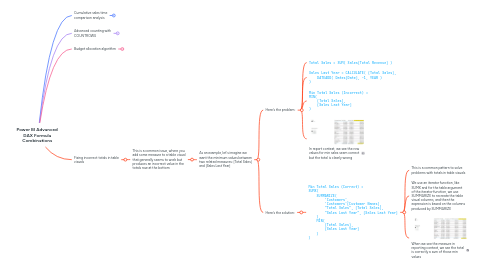
4.1.1.1. Here's the problem:
4.1.1.1.1. Total Sales = SUM( Sales[Total Revenue] )
4.1.1.1.2. Sales Last Year = CALCULATE( [Total Sales], DATEADD( Dates[Date], -1, YEAR ) )
4.1.1.1.3. Min Total Sales (Incorrect) = MIN( [Total Sales], [Sales Last Year] )
4.1.1.1.4. In report context, we see the row values for min sales seem correct but the total is clearly wrong
4.1.1.2. Here's the solution:
4.1.1.2.1. Min Total Sales (Correct) = SUMX( SUMMARIZE( 'Customers', 'Customers'[Customer Names], "Total Sales", [Total Sales], "Sales Last Year", [Sales Last Year] ), MIN( [Total Sales], [Sales Last Year] ) )