

1. PREVIOUS STEPS
1.1. MAPS should have Variables to encode
1.1.1. generally **merging** of DataFrame into GeoDataFrame is needed
1.1.1.1. this may take some time and require FUZZY merging
1.1.1.2. SET operations are very helpful to detect matching problems
1.2. CRS may or may not be changed
2. Dot Density Maps
2.1. represented by SEVERAL DOTS
2.1.1. distributed randomly in an area (Polygon)
2.2. encodes
2.2.1. variable values (integers) by means of density of plots
2.3. preprocessing
2.3.1. compute the dot UNIT, a constant value for each dot.
2.3.1.1. dots will have same size
2.3.2. random location of dots
2.3.2.1. **GDF**.sample_points(**"dots for the polygon**)
2.3.2.1.1. **GDF**.explode(index_parts=True)
2.3.3. set CRS to an EqualArea projection
3. Proportional Symbols Maps
3.1. represented by ONE SYMBOL (circle)
3.1.1. located generally in the center of polygon (centroid)
3.2. encodes
3.2.1. variable values by means of size of symbol
3.2.1.1. symbols have different sizes
3.3. preprocessing
3.3.1. computing location for the symbol
3.3.1.1. decide
3.3.1.1.1. ['geometry'].centroid
3.3.1.1.2. representative_point()
3.3.2. set CRS to an EqualArea projection
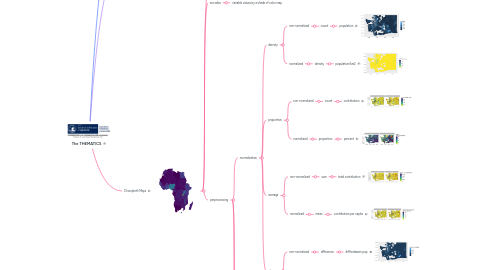
4. Choropleth Maps
4.1. represented by COLOR maps
4.2. encodes
4.2.1. variable values by a shade of color map
4.3. preprocessing
4.3.1. normalization
4.3.1.1. density
4.3.1.1.1. non-normalized
4.3.1.1.2. normalized
4.3.1.2. proportion
4.3.1.2.1. non-normalized
4.3.1.2.2. normalized
4.3.1.3. average
4.3.1.3.1. non-normalized
4.3.1.3.2. normalized
4.3.1.4. change
4.3.1.4.1. non-normalized
4.3.1.4.2. normalized
4.3.2. discretization
4.3.2.1. cut the variable
4.3.2.1.1. show intervals
4.3.2.1.2. show levels
4.3.3. set CRS to an EqualArea projection