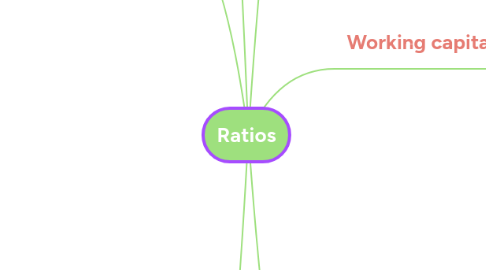
1. % Profitability
1.1. Gross profit margin = Gross Profit / Revenue * 100%
1.1.1. Product price, Row materials price, Sales structure, Productivity, Bulk discounts
1.2. Operating profit margin = Operating profit / Revenue *100%
1.2.1. Revenue less operating costs (do not considers financial +/- and tax)
1.3. Profit before tax margin = Profit before tax / Revenue *100%
1.3.1. Eliminates the distorting effect of changes in tax rates
1.4. Profit after tax margin = Profit for the year / Revenue * 100%
1.4.1. All income and all expences
2. Efficiency
2.1. Net asset turnover = Revenue / Net assets
2.1.1. Revenue per 1 pound of net assets. I.e. how effectively company uses assets
2.2. Non-current assets turnover = Revenue / Non-current assets
2.2.1. Revenue per 1 pound of non-current assets, i.e. how effectively company uses them
2.3. Revenue per employee = Total revenue / Total number of employees
2.3.1. Measures efficiency and productivity per employee, cost control
2.4. Profit per employee = Operating profit / Total number of employees
2.4.1. Measures efficiency and productivity per employee, cost control
2.5. Sales per unit of input resource = Total revenue / Total number of units (shops)
2.5.1. Measures efficiency and productivity per unit of resource, cost control
2.6. Profit per unit of resource = Operating profit / Total number of units (shops)
2.6.1. Measures efficiency and productivity per unit of resource, cost control
3. Performance
3.1. Earnings per share (EPS) = Profit after taxation and after preference dividends / Number of ordinary shares in issue *100 pence
3.1.1. pence
3.1.1.1. Stock market evaluation, directly influences share price growth, depends on the economy
3.2. Price/Ernings ratio (P/E ratio) = Market value of one ordinary share / Earnings per share
3.2.1. years
3.2.1.1. Years to pay back the share price, the more P/E ratio the more confident the market is about those shares (the more secure is the dividend flow, the more steady profits)
3.3. Dividends per share (DPS) = Total ordinary dividends / Number of ordinary shares in issue * 100 pence
3.3.1. pence
3.3.1.1. Like EPS should keep rising, shows confidence in future profits, influences share price
3.4. Payout ratio = Dividends per share / Earnings per share *100%
3.4.1. %
3.4.1.1. Shows how much profits was paid as dividends and how much retained in the business for future expansion and increase in sales and profits
3.5. Dividend yield = Ordinary dividends per share / Current market price of one ordinary share *100%
3.5.1. %
3.5.1.1. Could be a benchmark to compare with the bank interest, but rising share price should be also taken into account
3.6. Dividend cover = Profit after tax and after preference dividends / Total ordinary dividends
3.6.1. times
3.6.1.1. How many times dividends could be paid from the profit, measures the security of dividends (the higher -the better), 1 means all profit was paid out as dividends
3.7. Return on capital employed (ROCE) = Profit before interest and tax / Total capital employed *100%
3.7.1. %
3.7.1.1. Could be a benchmark to compare with the bank interest but might contain the obsolete data when evaluating assets (capital), includes debt
3.8. Return on Shareholders Funds (ROSF) = Profit before interest and tax / Total capital employed *100%
3.8.1. %
3.8.1.1. Shows how effectively business uses equity funds compared to ROCE (exduding debt), but might contain the obsolete data when evaluating assets (capital)
4. Liquidity
4.1. Current ratio = Current assets / Current Liabilities
4.1.1. Shows whether the company has sufficient current assets to meet its current liabilities (ideally 2:1), but the ratio compares numbers only at one particular day, it can be a different number tomorrow
4.2. Quick ratio (acid test) = (Current assets - Inventory) / Current Liabilities
4.2.1. Shows whether the company will survive in the economic situation when it cannot sell products (ideally = 1 trade receivable: 1 current liabilities)
5. Working capital
5.1. Working capital = Current Assets - Current Liabilities
5.1.1. GBP
5.1.1.1. Comprises all current assents, but does I not include tax and debt liabilities
5.2. Inventory days (Inventory turnover) = Inventory / Cost of sales *365
5.2.1. days
5.2.1.1. Shows how long the company holds goods before they are sold (the shorter - the better)
5.3. Receivable days (Debtor days) = Trade receivables / Credit sales (or Total sales) *365
5.3.1. days
5.3.1.1. Shows the average credit period taken by customers, efficiency of credit control (Cash Sales should be omitted, but in practice Total Sales are used)
5.4. Payable days (Creditor days) = Trade payables / *365 Cost of sales
5.4.1. days
5.4.1.1. Shows how quickly the company pays off its purchases (ideally, should be equal to receivable days)
5.5. Cash conversion cycle = Inventory days + Receivables days - Payable days
5.5.1. days
5.5.1.1. Shows the length of the whole cash cycle (the shorter - the better, otherwise the company needs to use overdraft), a negative number is very good
6. Long-term solvency
6.1. Gearing 1 = Long and short term borrowings / Equity *100%
6.1.1. %
6.1.1.1. Measures risks (the more debt, the more risky the company is)
6.2. Gearing 2 = Long term debt / (Equity + Long term debt)*100%
6.2.1. %
6.2.1.1. Measures risks (the more debt, the more risky the company is)
6.3. Debt ratio = Total liabilities / Total assets
6.3.1. GBP
6.3.1.1. Measures how many GBP of liabilities are per 1 GBP of assets, assesses risks and solvency
6.4. Interest cover = Profit before interest and tax / Interest
6.4.1. times
6.4.1.1. Assesses haw many times interest is covered by operating profit (the higher - the better, as it shows the ability to meet interest payments In the future)
