

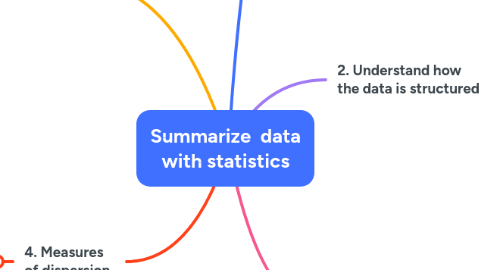
Summarize data with statistics
создатель Guillem Perdigo
1. 1. Understand data types
1.1. Qualitative
1.1.1. Nominal
1.1.2. Ordinal
1.2. Quantitative
1.2.1. Discrete
1.2.2. Continuous
2. 5. Graphical representations
2.1. Boxplot
2.1.1. Outliers
2.2. Histogram
2.2.1. How to read
2.2.2. Bins
2.2.3. Peaks (Distributions)
3. 2. Understand how the data is structured
3.1. Stductured data
3.1.1. Rectancular data
3.1.1.1. Columns
3.1.1.2. Rows
3.1.1.3. Index
3.2. Semi-structured data
3.3. Unstructured data
4. 4. Measures of dispersion
4.1. Range
4.2. Interquartile range
4.3. Variance
4.3.1. Notation (squared sigma)
4.3.2. Formula
4.3.3. Sample/Population
4.4. Standard deviation
4.4.1. Notation (sigma)
4.4.2. Formula
4.4.3. Sample/Population