Раскройте весь потенциал своих проектов.
Попробуйте MeisterTask бесплатно.
Нет аккаунта?
Бесплатно
Просматривать
Избранные Карты
Категории
Управление проектом
Бизнес и цели
Человеческие ресурсы
Мозговой штурм и анализ
Маркетинг и контент
Образование и заметки
Развлечения
Жизнь
Технологии
Дизайн
Резюме
Другое
Язык
English
Deutsch
Français
Español
Português
Nederlands
Dansk
Русский
日本語
Italiano
简体中文
한국어
Другое
Показать всю карту
Копировать/изменить
Копировать
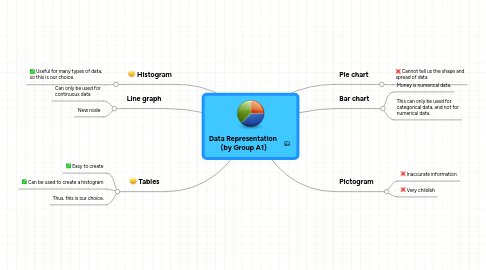
Data Representation (by Group A1)
Другое
SK
S_h_a_r_o_n Khoo
Отслеживать
Начать.
Это бесплатно
Войти через Google
или
регистрация
c помощью Вашего email-адреса
Похожие Интеллект-Карты
План Интеллект-Карты
Data Representation (by Group A1)
создатель
S_h_a_r_o_n Khoo
1. Histogram
1.1. Useful for many types of data, so this is our choice.
2. Tables
2.1. Easy to create
2.2. Can be used to create a histogram
2.3. Thus, this is our choice.
3. Line graph
3.1. Can only be used for continuous data
3.2. New node
4. Pie chart
4.1. Cannot tell us the shape and spread of data
5. Pictogram
5.1. Inaccurate information
5.2. Very childish
6. Bar chart
6.1. Money is numerical data.
6.2. This can only be used for categorical data, and not for numerical data.
Начать. бесплатно!
Связать с Google
или
Регистрация