

5. DataViz and Sharing
создатель Profesor Magallanes
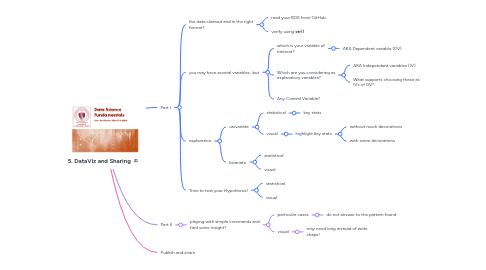
1. Part I
1.1. the data cleaned and in the right format?
1.1.1. read your RDS from GitHub
1.1.2. verify using **str()**
1.2. you may have several variables...but
1.2.1. which is your variable of interest?
1.2.1.1. AKA Dependent variable (DV)
1.2.2. Which are you considering as explanatory variables?
1.2.2.1. AKA Independent variables (IV)
1.2.2.2. What supports choosing these as IVs of DV?
1.2.3. Any Control Variable?
1.3. exploration
1.3.1. univariate
1.3.1.1. statistical
1.3.1.1.1. key stats
1.3.1.2. visual
1.3.1.2.1. highlight key stats
1.3.2. bivariate
1.3.2.1. statistical
1.3.2.2. visual
1.4. Time to test your Hypothesis!
1.4.1. statistical
1.4.2. visual
2. Part II
2.1. playing with simple commands and find some insight?
2.1.1. particular cases
2.1.1.1. do not answer to the pattern found
2.1.2. visual
2.1.2.1. may need long instead of wide shape!