

1. Components
1.1. Title
1.1.1. Main: "The title is the answer"
1.1.2. Sub: Just for the specifics (place, time, etc)
1.2. Axes
1.2.1. Includes Zero?
1.2.1.1. Always in bars
1.2.1.2. May be optional in lines
1.2.2. Units of measurement
1.2.3. annotations might make them irrelevant
1.2.3.1. benefit data-to-ink ratio
1.3. Caption
1.3.1. Source: cite!
1.3.2. Some technical notes
1.3.2.1. for example:
1.4. Annotations
1.4.1. not for all values
1.4.2. a tool for focus
1.4.3. can be
1.4.3.1. text
1.4.3.2. line
1.4.3.3. rectangle
1.4.3.4. picture
1.5. Background
1.5.1. Grid
1.5.1.1. complexity
1.5.2. Margins
1.5.2.1. flexibility
1.6. Legend
1.6.1. helps?
1.6.2. not much help!
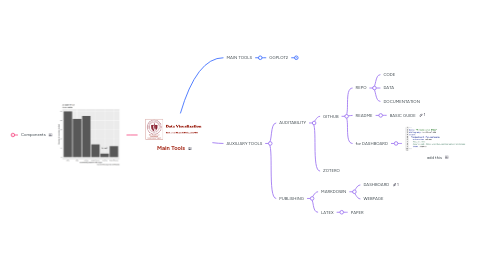
2. MAIN TOOLS
2.1. GGPLOT2
2.1.1. basic tool
2.1.2. ecosystem
3. AUXILIARY TOOLS
3.1. AUDITABILITY
3.1.1. GITHUB
3.1.1.1. REPO
3.1.1.1.1. CODE
3.1.1.1.2. DATA
3.1.1.1.3. DOCUMENTATION
3.1.1.2. README
3.1.1.2.1. BASIC GUIDE
3.1.1.3. for DASHBOARD
3.1.1.3.1. add this
3.1.2. ZOTERO
3.2. PUBLISHING
3.2.1. MARKDOWN
3.2.1.1. DASHBOARD
3.2.1.2. WEBPAGE
3.2.2. LATEX
3.2.2.1. PAPERs
3.2.2.2. BOOKS