
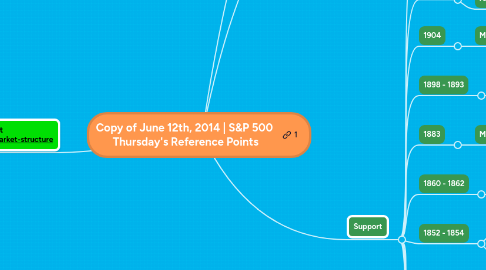
1. For Detailed Information Visit http://followthebots.com/market-structure
2. Resistance
2.1. How To Sell Resistance
2.2. 1960
2.2.1. Minimum range extension estimate
2.3. 1954
2.3.1. 09-JUN-2014 High
3. Wednesday's Close 1944.00
4. Support
4.1. 1936
4.1.1. Minor intraday support 05-JUN-2014
4.1.1.1. 1st link in the hidden markov chain
4.1.1.2. 17 points below the current high
4.1.1.3. 28 points below the new record high
4.2. 1922
4.2.1. Approximate mid-point, 24 pointsabove the previous high at 1898, and 28 points below the new record high
4.3. 1904
4.3.1. Minor support:
4.3.1.1. 27-MAY-2014 low
4.3.1.2. 28-MAY-2014 low
4.4. 1898 - 1893
4.4.1. Minor support
4.4.1.1. Previous resistance
4.4.1.2. The two prior record highs
4.5. 1883
4.5.1. Minor Support
4.5.1.1. 21-MAY-2014 high
4.5.1.2. 22-MAY-2014 low
4.6. 1860 - 1862
4.6.1. Support
4.6.1.1. Previous low on 06-MAY-2014
4.6.1.2. 09-MAY-2014 Low
4.7. 1852 - 1854
4.7.1. 07-MAY-2014 low
4.7.2. Support
4.7.2.1. 25-APR-2014 Previous low
4.8. 1844 - 1846
4.8.1. Near term support
4.8.1.1. 28-APR-2014 low
4.8.1.2. 17-APR-2014 low
4.8.1.3. 17-APR-2014 overnight low
4.9. 1834 - 1836
4.9.1. Support
4.9.1.1. 15-APR-2014 high
4.9.1.2. Previously major support
4.10. 1828
4.10.1. Support at the intraday price levels
4.10.1.1. support preceded the breakout up to 21-APR-2014 overnight high, 1848
4.11. 1807
4.11.1. Major Support at 11-MAR-2014
4.11.1.1. 14-MAR-204 & 15-MAR-2014 Lows
4.12. 1800
4.12.1. The key psychological level