

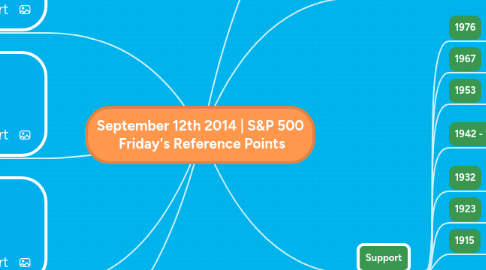
September 12th 2014 | S&P 500 Friday's Reference Points
создатель Carl Weiss
1. Zig Zag Chart
2. Polynomial Regression Chart
3. Frequency Distribution Chart
4. For Detailed Information Visit http://followthebots.com/market-structure
5. Resistance
5.1. How To Sell Resistance
5.2. 2020
5.2.1. Maximum Likelihood expectation estimate
5.3. 2008 - 2010
5.3.1. New Record High
6. Thursday's Close 1989.00
7. Support
7.1. 1976
7.1.1. 11-SEP-2014 Low
7.1.1.1. The Start of the December contract
7.2. 1967
7.2.1. 18-AUG-2014 close (gap)
7.2.1.1. 1964 low
7.3. 1953
7.3.1. Support
7.3.1.1. 15-AUG-2014 Close " Gap"
7.4. 1942 - 1944
7.4.1. Support
7.4.1.1. What had been support during June and July was resistance on the initial retracement
7.5. 1932
7.5.1. Near Term Support
7.5.1.1. 13-AUG-2014 Low
7.6. 1923
7.6.1. Support
7.6.1.1. 12-AUG-2014 Low
7.7. 1915
7.7.1. Support
7.7.1.1. Intraday Opening Range High
7.8. 1900 - 1903
7.8.1. Near Term Support
7.8.1.1. 08-AUG-2014 Low
7.8.1.2. Key Psycology Support Level
7.8.1.3. Fractal Lows Previously 13-MAY-2014 High
7.8.1.4. retested on 28-MAY-2014