Statistical measures Univariate
作者:Leinny Tette
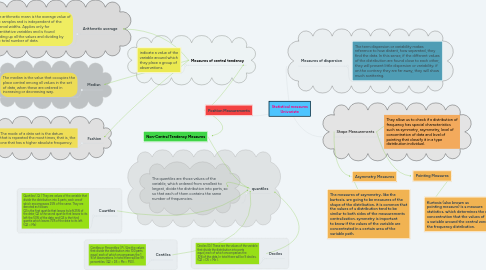
1. Position Measurements
2. Measures of central tendency
2.1. indicate a value of the variable around which they place a group of observations.
3. Non-Central Tendency Measures
4. Arithmetic average
4.1. The arithmetic mean is the average value of the samples and is independent of the interval widths. Applies only for quantitative variables and is found Adding up all the values and dividing by the total number of data.
5. Measures of dispersion
5.1. The term dispersion or variability makes reference to how distant, how separated, they find the data. In this sense, if the different values of the distribution are found close to each other, they will present little dispersion or variability; if on the contrary they are far away, they will show much scattering.
6. quantiles
6.1. The quantiles are those values of the variable, which ordered from smallest to largest, divide the distribution into parts, so so that each of them contains the same number of frequencies.
7. Median
7.1. The median is the value that occupies the place central among all values in the set of data, when these are ordered in increasing or decreasing way.
8. Fashion
8.1. The mode of a data set is the datum that is repeated the most times, that is, the one that has a higher absolute frequency.
9. Cuartiles
9.1. Quartiles ( Qi ) They are values of the variable that divide the distribution into 4 parts, each oneof which encompasses 25% of the same. They are denoted as follows: Q1 is the first quartile that leaves its left 25% of the data; Q2 is the secnd quartile that leaves to its left the 50% of the data, and Q3 is the third quartie which leaves 75% of the data to its left. (Q2 = Me)
10. Deciles
10.1. Deciles (Di) These are the values of the variable that divide the distribution into parts equal, each of which encompasses the 10% of the data. In total there will be 9 deciles. (Q2 = D5 = Me ).
11. Centiles
11.1. Centiles or Percentiles ( Pi ) Are the values that divide the distribution into 100 parts equal, each of which encompasses the 1 % of observations. In total there will be 99 percentiles. (Q2 = D5 = Me = P50).
12. Shape Measurements
12.1. They allow us to check if a distribution of frequency has special characteristics such as symmetry, asymmetry, level of concentration of data and level of pointing that classify it in a type distribution individual.
13. Asymmetry Measures
14. Pointing Measures
15. The measures of asymmetry, like the kurtosis, are going to be measures of the shape of the distribution, it is common that the values of a distribution tend to be similar to both sides of the measurements centralization. symmetry is important to know if the values of the variable are concentrated in a certain area of the variable path.
16. Kurtosis (also known as pointing measure) is a measure statistics, which determines the degree of concentration that the values of a variable around the central zone of the frequency distribution.

