
Data Analysis Tools (Group A1)
作者:S_h_a_r_o_n Khoo
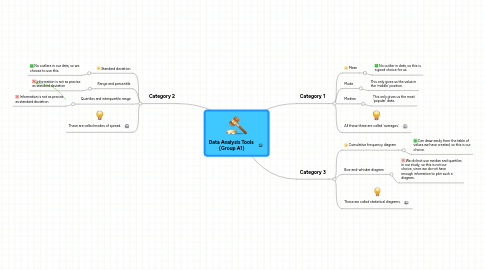
1. Category 2
1.1. Standard deviation
1.1.1. No outliers in our data, so we choose to use this.
1.2. Range and percentile
1.2.1. Information is not as precise as standard deviation
1.3. Quartiles and interquartile range
1.3.1. Information is not as precise as standard deviation
1.4. These are called modes of spread.
2. Category 1
2.1. Mean
2.1.1. No outlier in data, so this is a good choice for us.
2.2. Mode
2.2.1. This only gives us the value in the 'middle' position.
2.3. Median
2.3.1. This only gives us the most 'popular' data.
2.4. All these three are called 'averages'.
3. Category 3
3.1. Cumulative frequency diagram
3.1.1. Can draw easily from the table of values we have created, so this is our choice.
3.2. Box-and-whisker diagram
3.2.1. We did not use median and quartiles in our study, so this is not our choice, since we do not have enough infomation to plot such a diagram.