Data Representation (by Group A1)
作者:S_h_a_r_o_n Khoo
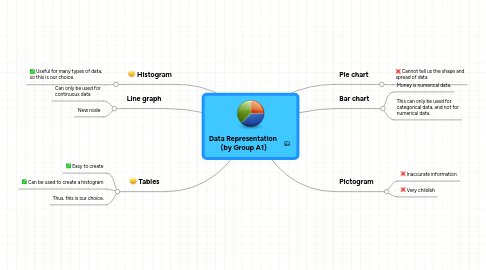
1. Histogram
1.1. Useful for many types of data, so this is our choice.
2. Tables
2.1. Easy to create
2.2. Can be used to create a histogram
2.3. Thus, this is our choice.
3. Line graph
3.1. Can only be used for continuous data
3.2. New node
4. Pie chart
4.1. Cannot tell us the shape and spread of data
5. Pictogram
5.1. Inaccurate information
5.2. Very childish
6. Bar chart
6.1. Money is numerical data.
6.2. This can only be used for categorical data, and not for numerical data.
