
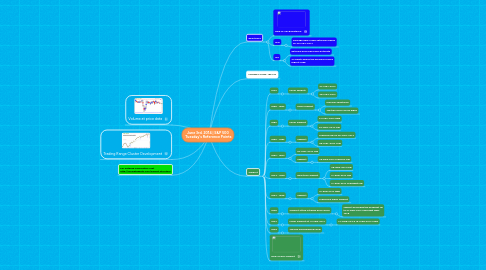
1. Volume at price data
2. Trading Range Cluster Development
3. For Detailed Information Visit http://followthebots.com/market-structure
4. Resistance
4.1. How To Sell Resistance
4.2. 1931
4.2.1. Average daily range extension based on 30-MAY-2014
4.3. 192
4.3.1. Extreme Price Excursion Estimate
4.3.2. 24 points above the previous record high at 1898
5. Monday's Close 1921.75
6. Support
6.1. 1904
6.1.1. Minor support:
6.1.1.1. 27-MAY-2014
6.1.1.2. 28-MAY-2014
6.2. 1898 - 1893
6.2.1. Minor support
6.2.1.1. Previous resistance
6.2.1.2. The two prior record highs
6.3. 1883
6.3.1. Minor Support
6.3.1.1. 21-MAY-2014 high
6.3.1.2. 22-MAY-2014 low
6.4. 1860 - 1862
6.4.1. Support
6.4.1.1. Previous low on 06-MAY-2014
6.4.1.2. 09-MAY-2014 Low
6.5. 1852 - 1854
6.5.1. 07-MAY-2014 low
6.5.2. Support
6.5.2.1. 25-APR-2014 Previous low
6.6. 1844 - 1846
6.6.1. Near term support
6.6.1.1. 28-APR-2014 low
6.6.1.2. 17-APR-2014 low
6.6.1.3. 17-APR-2014 overnight low
6.7. 1834 - 1836
6.7.1. Support
6.7.1.1. 15-APR-2014 high
6.7.1.2. Previously major support
6.8. 1828
6.8.1. Support at the intraday price levels
6.8.1.1. support preceded the breakout up to 21-APR-2014 overnight high, 1848
6.9. 1807
6.9.1. Major Support at 11-MAR-2014
6.9.1.1. 14-MAR-204 & 15-MAR-2014 Lows
6.10. 1800
6.10.1. The key psychological level