Communication Functions of Graphics
by Azlin Aziz
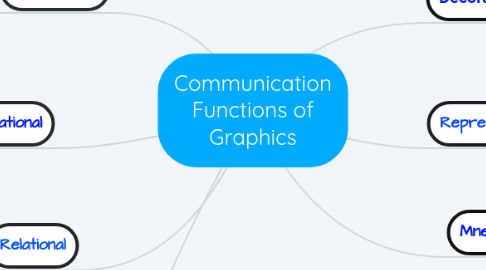
1. Organizational
1.1. A graphic used to show qualitative relationships among content
1.2. For examples, a two-dimensional course map or a concept tree
2. Relational
2.1. A graphic used to show quantitative relationships among two or more variables
2.2. For examples, a line graph or a pie chart.
3. Transformational
3.1. A graphic used to show changes in objects over time or space
3.2. For examples, an animation of the weather cycle or a video showing how to operate equipment
4. Interpretive
4.1. A graphic used to illustrate a theory, principle, or cause-and-effect relationships
4.2. For examples, a schematic diagram of equipment and an animation of molecular movement
5. Decorative
5.1. A Graphic used to add aesthetic appeal or humor
5.2. For examples, art on the cover of a book or visual of a general in a military lesson on ammunition
6. Representational
6.1. A graphic used to depict an object in a realistic fashion
6.2. For examples, a screen capture of a software screen or a photograph of equipment
7. Mnemonic
7.1. A graphic used to provide retrieval cues for factual information
7.2. For example, a picture of a stamped letter in a shopping cart to recall the meaning of the Spanish word, Carta (letter)

