INFOGRAPHIC
by Rizky Azis
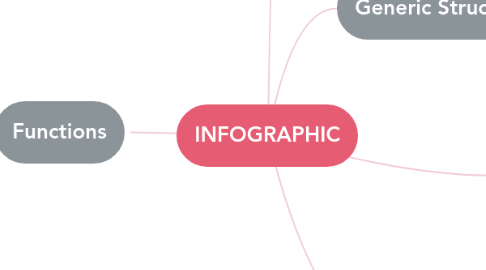
1. Functions
1.1. A statistical infographic puts the focus on your data.
1.2. Informational Infographic aims to make the data easily understandable at a first glance
1.3. Timeline infograpic depicts events or actions in chronological order
1.4. Process infographic depicts decision-making processes.
1.5. Comparison infographic examines the similarities and differences between two or more products
1.6. Geographical infographics show data trends based on location
1.7. Hierarchical Infographic organize information into pre-defined levels (greatest to least)
1.8. List Infographic show information by list to shares a lot of information in the form text and icons.
2. Definition
2.1. A collection of imagery, charts, and minimal text that gives an easy-to-understand overview of a topic
3. Language Features
3.1. Accessible
3.2. Informative
3.3. Engaging
4. Generic Structure
4.1. • Headline/ Title • Beginning/ Introduction • Middle/ Main infographic content • End/ Conclusion • Sources and footnotes
5. Characteristics
5.1. • Clear goals • Easy to digest • Compelling narrative • Unique concept • Creative design • Visual focus – not text
