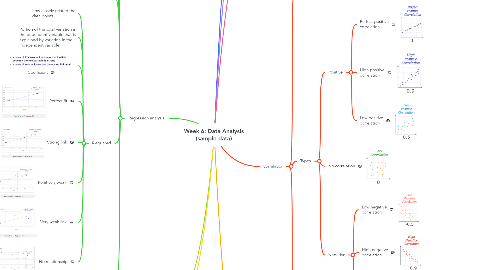
1. Regression analysis
1.1. Linear regression
1.1.1. To predict value of a variable based on the other one
1.2. Dependent variable
1.2.1. Variable want to predict
1.3. Independent variable
1.3.1. Variable used to predict
1.4. R-squared
1.4.1. how closely related the data points
1.4.2. Portion of the total variation in the dependent variable that is explained by variation in the independent variable
1.4.3. Coefficient
1.4.4. Perfect fit
1.4.5. Strong link
1.4.6. Relatively weak
1.4.7. Very weak link
1.4.8. No relationship
1.5. MS Excel: Run regression in Excel: https://www.youtube.com/watch?v=B-tFvua7qV4
2. Probability distributions
2.1. Different ways of distributions
2.2. Normal distributions (mean = median = mode)
2.2.1. Examples: heights of people, size of things produced by machines, erros in measurements, blood pressure, marks on a test.
2.3. Standard deviation
2.3.1. 1 standard deviation of the mean
2.3.2. 2 standard deviations of the mean
2.3.3. 3 standard deviations of the mean
2.4. Converting normal distribution to standard normal distribution
2.5. Confidence intervals: consideration given to how confident, indicate a range of values and the probability
2.6. Discrete vs. continuous probability distribution
2.6.1. Discrete data (take only certain values)
2.6.1.1. The number of students in a class
2.6.1.2. The results of rolling a dice
2.6.2. Discrete probability distribution (rolling a dice)
2.6.3. Examples of discrete probability distributions
2.6.3.1. Binomial distributions: two possible outcome
2.6.3.2. Geometric distribution
2.6.3.3. Hypergeometric distribution
2.6.3.4. Multinomial distribution
2.6.3.5. Negative binomial distribution
2.6.3.6. Poisson distribution
2.6.4. Continuous data (take any value)
2.6.4.1. A person's height
2.6.4.2. Time taken to sell a product
2.6.4.3. The weight of a bag of coffee beans
2.6.4.4. The speed of cars
3. Testing hypotheses
3.1. Hypothesis is a statement that might be true
3.2. Sample is selected from population
3.3. Samples should be chosen randomly
3.4. Types
3.4.1. Null hypothesis (H0)
3.4.1.1. no effect, relationship or difference
3.4.2. Alternative hypothesis (H1)
3.4.2.1. Having effect or difference
3.5. Level of significance
3.5.1. How confident before rejecting null hypothesis and accepting alternative hypothesis
3.6. z-score
3.6.1. Can be translated to a p-value
3.6.2. Higher z-score = lower p-value
3.7. p-value
3.7.1. The probability that the null hypothesis is true
3.7.2. To determine the significane of the results in relation to the null hypothesis
3.8. t-score
3.8.1. Used when null dataset and the corresponding standard deviation may not be available
3.8.2. Can be translated to a p-value
3.9. drawing conclusion
3.9.1. p-value is less than or equal to significance level
3.9.1.1. Null hypothesis is rejected/ alternative hypothesis is accepted
3.9.2. p-value is greater than significance level
3.9.2.1. null hypothesis is retained/ alternative hypothesis is rejected
3.10. Nonparametric tests
3.10.1. Used when dataset dont follow a normal distribution
3.10.2. As distribution-free tests
3.10.3. Makes fewer assumptions
3.10.4. Example
3.10.4.1. Chi-square test
3.10.4.1.1. To compare observed results with expected results
3.10.4.1.2. The difference is due to chance or a relationship
3.11. Omitted variable bias
3.11.1. significant variable be left out
3.11.2. Having correlation with independent variable, causal relationship with dependent variable
3.11.3. Causing missspecification in the model
3.11.4. Identify a potential omitted variable
3.12. General approach (6 steps)
3.12.1. 1) State the null and alternative hypothesis, H0 and H1
3.12.2. 2) Choose the level of significance
3.12.3. 3) Determine the appropriate test statistic and sampling distribution
3.12.4. 4) Collect data and calculate the value of the test statistic
3.12.5. 5) Translate the test statistic to a p-value
3.12.6. 6) Based on p-value: reject or retain the null/alternative hypothesis
3.12.7. 7) Express the conclusion
4. Definition
4.1. Process of systematically applying statistical techniques
5. Types
5.1. Quantitative
5.1.1. numerical information
5.1.2. Types
5.1.2.1. Descriptive statistics
5.1.2.1.1. To summarise: mean, median, mode and variance
5.1.2.2. Inferential statistics
5.1.2.2.1. To make predictions: confidence intervals, hypothesis testing and regression analysis
5.2. Qualitative
5.2.1. non-numerical data: text, video, audio data, interviews and focus groups
6. Relationship between two variables
6.1. Why it is important?
6.1.1. Make Prediction
6.1.2. Understand if, or how much, a particular factor contributes to variables of interest
6.1.2.1. increase or decrease
6.1.2.2. same or opposite direction
6.2. Look at: Correlation and causation
7. Correlation
7.1. Measurement: "r" (correlation coefficient) between -1 and 1
7.2. Types
7.2.1. Positive
7.2.1.1. Perfect positive correlation
7.2.1.2. High positive correlation
7.2.1.3. Low positive correlation
7.2.2. No correlation
7.2.3. Negative
7.2.3.1. Low negative correlation
7.2.3.2. High negative correlation
7.2.3.3. Perfect negative correlation
7.3. MS Excel: correl(dataA, DataB)
7.3.1. Example
7.3.1.1. Correl
8. Causation
8.1. Causes changes in another variable or event
8.2. correlation does not imply causation
8.2.1. example
