Data representation
作者:W elovenusmath

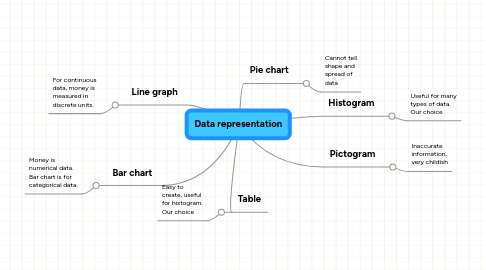
1. Line graph
1.1. For continuous data, money is measured in discrete units.
2. Bar chart
2.1. Money is numerical data. Bar chart is for categorical data.
3. Table
3.1. Easy to create, useful for histogram. Our choice
4. Pie chart
4.1. Cannot tell shape and spread of data
5. Histogram
5.1. Useful for many types of data. Our choice
6. Pictogram
6.1. Inaccurate information, very childish


