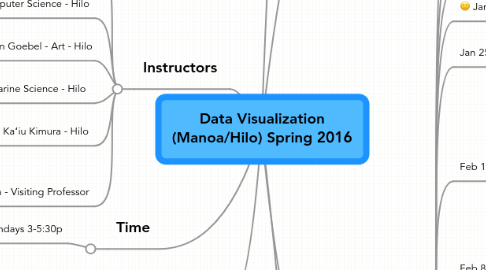
1. Instructors
1.1. Jason Leigh - Computer Science - Manoa
1.1.1. http://www2.hawaii.edu/~leighj/JASON_LEIGH/Jason_Leigh_Home_Page.html
1.1.2. Office Hours:
1.1.2.1. Mondays & Wednesdays 2-3p in Keller 102
1.2. Jie Cheng - Computer Science - Hilo
1.2.1. http://cs.uhh.hawaii.edu/jiecheng.html
1.3. Jonathon Goebel - Art - Hilo
1.3.1. http://www.jongoebel.com/bio
1.4. Misaki Takabayashi - Marine Science - Hilo
1.4.1. http://maunaloa.uhh.hawaii.edu/~misaki/About_Misaki_Takabayashi.html
1.5. Kaʻiu Kimura - Hilo
1.5.1. https://www.linkedin.com/pub/kaʻiu-kimura/14/507/172
1.6. Julieta Aguilera - Visiting Professor
1.6.1. https://www.linkedin.com/in/julietina
1.6.2. Office hours
1.6.2.1. Wednesdays 3-5:45pm at Imiloa
2. Time
2.1. Mondays 3-5:30p
3. Location
3.1. Manoa CyberCANOE in Keller 102
3.2. Imiloa Astronomy Center
4. Class Survey
5. Schedule
5.1. https://manoa.hawaii.edu/ovcaa/calendar.htm
5.2. http://hilo.hawaii.edu/registrar/Spring2016SemesterAcademicCalendar.php
5.3. Jan 11 - First day of class
5.3.1. Overview of Data Visualization - everything from Info Viz to Sci Viz etc...
5.3.2. Intro to class
5.3.3. Using the CyberCANOE
5.3.4. Survey on abilities
5.3.5. Intro to tools- Unity3D
5.4. Jan 18 - MLK day
5.4.1. ASSIGNMENT 1 - PART 1 DUE - Submit to Laulima
5.5. Jan 25 - LECTURE
5.5.1. Intro to Data Visualization - from the Computer Science Perspective
5.6. Feb 1 - LECTURE
5.6.1. Intro to Data Visualization - from the Art Perspective
5.6.1.1. Jonathon, Jason, Julieta
5.6.2. Composition (elements & principles of design).
5.6.3. Creative Brainstorming
5.6.4. ASSIGNMENT 1 - PART 2 DUE- audition in class
5.7. Feb 8 - LECTURE
5.7.1. Intro to Coral Reef Biology & Data
5.7.1.1. Misaki
5.8. Feb 15 - Presidents day
5.9. Feb 22 - LECTURE
5.9.1. Bridging between Art and Science
5.9.1.1. Julieta
5.10. Feb 29 - LECTURE
5.10.1. Working with Data
5.10.1.1. Jie
5.10.2. DUE: BRAINSTORM IMAGES from the teams
5.10.3. Jason on travel
5.11. Mar 7 - LECTURE
5.11.1. Information Visualization
5.12. Mar 14 - LECTURE
5.12.1. Geospatial Visualization
5.13. March 21-25 - Spring break
5.14. March 28 - LECTURE
5.14.1. Dynamic Visualization
5.15. Apr 4 - LECTURE
5.15.1. Social Network Visualization
5.15.2. MID SEMESTER DEMOS
5.16. Apr 11 - LECTURE
5.16.1. Scientific & Medical Visualization
5.17. Apr 18 - LECTURE
5.17.1. Visual Analytics
5.17.2. Jason at NAB
5.18. Apr 25 - LECTURE
5.18.1. Uncertainty Visualization
