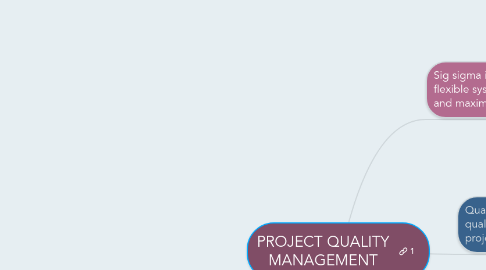
PROJECT QUALITY MANAGEMENT
by nur shafiqah

1. Sig sigma is "a comprehensive and flexible system for achieving, sustaining, and maximizing business success".
1.1. a)DEFINE: define the problem/opportunity, process, and customer requirement.
1.2. b) MEASURE: Define measure, then collect, compile, and display data.
1.3. c) ANALYZE: Scrutinize process details to find improvement opportunities.
1.4. d) IMPROVE: Generate solutions and ideas for improving the problem
1.5. c) ANALYZE: Scrutinize process details to find improvement opportunities.
2. Quality planning: identifying which quality standards are relevant to the project and how to satisfy them.
3. Quality assurance: periodically evaluating overall project performance to ensure the project will satisfy the relevant quality standard.
3.1. Quality audit - structured review
3.2. Benchmarking - ideas
4. Quality control: monitoring specific project results to ensure that they comply with the relevant quality standard.
4.1. a) cause-and-effect diagrams trace complaints about quality problems back to the responsible production operations.
4.2. b) control chart is a graphic display of data that illustrates the result of process over time.
4.3. c) Run Chart- displays the history and pattern of variation of a process over time.
4.4. d) scatter diagram helps to show if there is a relationship between two variables.
4.5. e) Histogram is a bar graph of a distribution of variables
4.6. f) Pareto chart is a histogram that can help you identify and prioritize problem areas.
4.7. g) Flowcharts are graphic displays of the logic and flow of processes.
4.8. h)Statistical sampling involves choosing part of a population of interest for inspection.


