
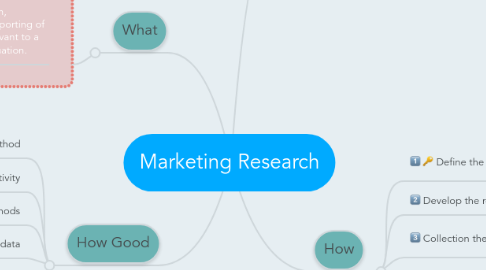
1. What
1.1. The systematic design, collection, analysis, reporting of data and findings relevant to a specific marketing situation.
2. How Good
2.1. Scientific method
2.2. Research creativity
2.3. Multiple methods
2.4. Interdependance of models and data
2.5. Value and cost of information
2.6. Healthy skepticism
2.7. Ethical marketing
3. Why
3.1. To link the consumer to the marketer by providing information used in making marketing decisions
4. How
4.1. Define the problem & research objectives
4.1.1. Understand decision maker problem
4.1.2. Translate those problems to marketing research problem
4.2. Develop the research plan
4.2.1. Identify Data sources
4.2.1.1. Secondary data
4.2.1.1.1. Low cost, less time consuming
4.2.1.1.2. May not be the target market. Reliability doubtful
4.2.1.1.3. Your competitor can obtain the same level of data
4.2.1.1.4. Refs
4.2.1.2. Primary data
4.2.1.2.1. take long time & money to collect
4.2.1.2.2. Exploratory approach
4.2.1.2.3. Descriptive & Causal approach
4.2.2. Choose Research Approaches
4.2.2.1. Observation & ethnographic
4.2.2.2. Focus group
4.2.2.3. Surveys
4.2.2.4. Behavioral data
4.2.2.5. Experiments
4.2.3. Research instrument
4.2.3.1. Questionnaires
4.2.3.1.1. question types
4.2.3.2. Qualitative Measures/Techniques
4.2.3.2.1. Word associations & counter
4.2.3.2.2. Visualization
4.2.3.2.3. Projective techniques
4.2.3.2.4. ZMET approach
4.2.3.2.5. Brand personification
4.2.3.2.6. Laddering
4.2.3.3. Technology devices
4.2.3.3.1. Eye-tracking
4.3. Collection the information
4.3.1. Online surveys
4.3.2. Telephone surveys
4.3.3. Interviews
4.3.4. In-home surveys
4.4. Analyse the information
4.4.1. Example questions
4.4.2. Measurement level
4.4.2.1. Nominal scale
4.4.2.2. Ordinal scale
4.4.2.3. Interval scale
4.4.2.4. Ration scale
4.4.3. Central tendancy
4.4.3.1. Mode
4.4.3.2. Median
4.4.3.3. Mean
4.4.4. Variability
4.4.4.1. Frequency
4.4.4.2. Percentage distribution
4.4.4.3. Cumulative percentage
4.4.4.4. Standard deviation
4.5. Present the findings
4.5.1. Find the compelling narrative
4.5.1.1. visualization methods: A Periodic Table of Visualization Methods
4.5.2. Think about your audience
4.5.2.1. 1. Novice: first exposure to the subject, but doesn't want oversimplification
4.5.2.2. 2. Generalist: aware of the topic, but looking for an overview understanding and major themes
4.5.2.3. 3. Managerial: in-depth, actionable understanding of intricacies and interrelationships with access to detail
4.5.2.4. 4. Expert: more exploration and discovery and less storytelling with great detail
4.5.2.5. 5. Executive: only has time to glean the significance and conclusions of weighted probabilities
4.5.3. Be ojective and offer balance
4.5.4. Don't Censor
4.5.5. Finally, edit, eidt, edit