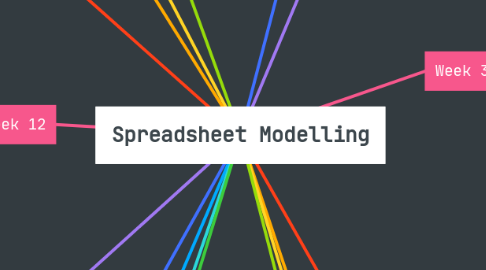
Spreadsheet Modelling
von Abel Mrong

1. Week 8
1.1. Data Consolidation
1.2. Sensitivity Analysis
1.3. What If Analysis
1.4. Goal Seek
1.5. Scenario Manager
2. Week 9
2.1. Exam 2
3. Week 10
3.1. Group Project Meeting
4. Week 11
4.1. Tables
4.2. Sorting and Filtering
4.3. Subtotals with Ranges
4.4. Quick Analysis Toolbar
5. Week 12
5.1. Data Modeling/ Power Pivot
5.2. Pivot Tables
6. Week 13
6.1. Data Visualization.
6.2. Excel Chart Creation
6.3. Dashboard
6.4. Power View Reports
6.5. Inquire
7. Week 14
7.1. Fall Break (no classes, campus open)
8. Week 15
8.1. Trend and Forecasting
8.2. Optimization Model Solver
9. Week 16
9.1. Group Project Submission and Presentation
10. Week 17
10.1. Final Exam
11. Week 1
11.1. Course Introduction
11.2. Syllabus Discussion
11.3. Data Analytics for Business and Management
12. Week 2
12.1. Basic of Spreadsheet Design and applications
12.2. Excel basics
12.3. Basics of Data Quality and Privacy
12.4. Data Cleaning
12.5. Excel Formula Anatomy
12.6. Function Anatomy
12.7. Ribbon
13. Week 3
13.1. Excel Layout Template
13.2. Mathematical function
13.3. Statistics function
13.4. Logical Functions
13.5. Conditional Formatting
13.6. Date Functions
13.7. Text Functions
13.8. Temporal Functions
14. Week 4
14.1. Lookup & Reference
14.2. Index
14.3. Match
14.4. Dynamic Array
14.5. Information Function
14.6. Data validation
14.7. Formula Auditing
14.8. External Links
15. Week 5
15.1. Exam 1
16. Week 6
16.1. Group Project Meeting
17. Week 7
17.1. Macros
17.2. Getting started with VBA
17.3. User Forms and Controls


