Graphical Organizers
von Tess Geever
1. Flow Chart
1.1. Chain of instructions for a complex process
1.2. Different shapes and symbols mean different things
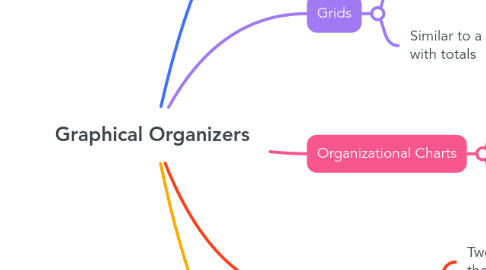
2. Grids
2.1. Used to compare multiple different options
2.2. Similar to a table for XY variables with totals
3. Organizational Charts
3.1. Shows how groups are organized and related to one another
3.2. Represents the structure of a company
4. Venn Diagram
4.1. Two/three circles that overlap in the middle
4.2. Shows relationship between two/three variables
5. Concept Map
5.1. What you are looking at right now!
5.2. Connects Ideas to one another
