
1. Optimizing data model size
1.1. In Query Editor, you can remove every column from your fact table that you are not going to use in a calculation or a filter in your report
1.2. In Query Editor, look for opportunities to denormalise two or more related columns into a lookup/dimension table
1.3. In Query Editor, look for opportunities to use parameters to filter and reduce the source data being brought in (e.g. fact transactional tables can be filtered to only include the last year rather than the whole of time)
2. Active vs inactive relationships
2.1. Although you can create more than one relationship between two tables, there can only be one active relationship
2.1.1. This commonly happens when you have a single Date table that relates to multiple different date columns in a fact table
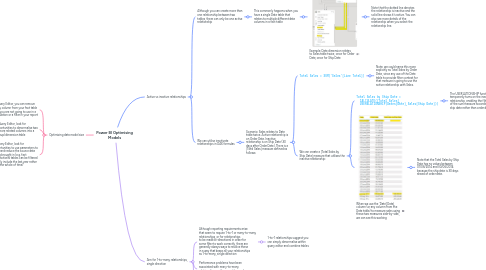
2.1.1.1. Example: Date dimension relates to Sales table twice, once for Order Date, once for Ship Date
2.1.1.1.1. Note that the dotted line denotes the relationship is inactive and the solid line shows it's active. You can also see more details of the relationship when you select the relationship line.
2.2. We can utilise inactivate relationships in DAX formulas
2.2.1. Scenario: Sales relates to Date table twice. Active relationship is on Order Date. Inactive relationship is on Ship Date (30 days after Order Date). There is a [Total Sales] measure defined as follows:
2.2.1.1. Total Sales = SUM('Sales'[Line Total])
2.2.1.1.1. Note: we could name this more explicitly as Total Sales by Order Date, since any use of the Date table to provide filter context for that measure is going to use the active relationship with Sales.
2.2.1.2. We can create a [Total Sales by Ship Date] measure that utilises the inactive relationship:
2.2.1.2.1. Total Sales by Ship Date = CALCULATE([Total Sales], USERELATIONSHIP(Dates[Date],Sales[Ship Date]))
2.2.1.2.2. When we use the 'Date'[Date] column (or any column from the Date table) to measure sales using these two measures side-by-side, we can see this working
3. Aim for 1-to-many relationships, single direction
3.1. Although reporting requirements arise that seem to require 1-to-1 or many-to-many relationships, or for relationships to be made bi-directional in order for some filter to work correctly, there are generally always ways to resolve these in a way that keeps all your relationships as 1-to-many, single direction
3.1.1. 1-to-1 relationships suggest you can simply denormalise within query editor and combine tables
3.2. Performance problems have been associated with many-to-many relationships, so they must be used with care
3.3. Model ambiguity can arise with bi-directional relationships, which can lead to inconsistent and confusing filtering behaviour in your reports
3.3.1. You can recognise this if you can trace more than one path from one table to another in your data model