

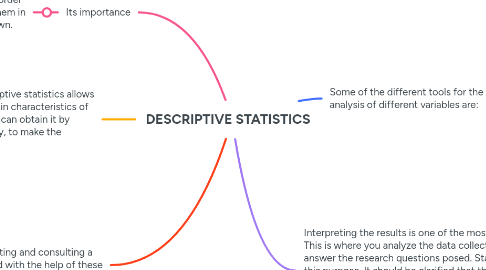
DESCRIPTIVE STATISTICS
von Luisa Fernanda
1. Descriptive statistics is very important for good decision making. This is because descriptive statistics allows us to know the main properties of the observed objects and data and to identify the main characteristics of the studied phenomenon through descriptive numerical measurements. The researcher can obtain it by summarizing the information of the data to be analyzed, under conditions of uncertainty, to make the appropriate decision, descriptive statistics is the foundation of inferential statistics.
2. The samples obtained by investigating and consulting a population or sample are organized with the help of these tools used by descriptive statistics to solve a problem:
2.1. Graphs
2.2. Tables
2.3. Measure of central tendency
2.4. Dispersion measurement
2.5. Frequency distributions
3. Its importance
3.1. Data are presented in the real world in no visible order and it is up to the statistician to make sense of them in order to learn about the conclusions that are drawn.
4. Some of the different tools for the analysis of different variables are:
4.1. Qualitative (categories)
4.1.1. Nominals ( A, B, C, D)
4.1.1.1. Classify
4.1.2. Ordinals ( I II III IV )
4.1.2.1. Hierarchize
4.2. Quantitative (numerical)
4.2.1. Discrete ( 1, 2, 3, 4 )
4.2.1.1. Count
4.2.2. Continuous ( 1,5 3,6 12,8 )
4.2.2.1. Measure