

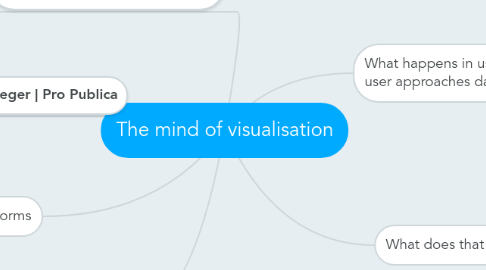
The mind of visualisation
von Patricia Ennenbach
1. HOW SCIENCE CAN HELP US BUILD BETTER DATA PROJECTS
1.1. We don't want to be wrong: We do not like to test if we're rightt
1.2. NYT : One Report Divergent Perspectives
1.2.1. showing biases
2. New Forms
2.1. Cartograms
2.2. y/n
2.3. workers compensation benefits
3. Optical Illusions
3.1. magicans direct your view by moving their hand straight or curved
4. Lena Groeger | Pro Publica
5. What happens in users mind when user approaches data project
5.1. We're not rational
5.2. Framing
5.2.1. 10/100 have problems is perceived titally different from 90/100 with no problems
5.2.2. Brain scans influence jurys decision more than other evidence - even if they're just pretty
5.2.3. = We have mental frames, even if we think we're deciding rational