

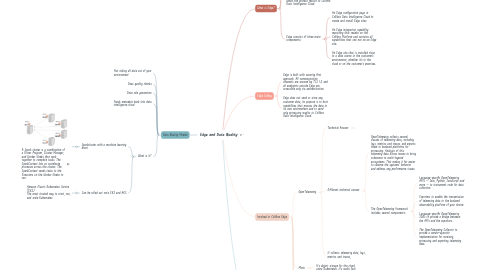
1. Data Quality Module
1.1. Not taking all data out of your environment
1.2. Does quality checks
1.3. Does rule generation
1.4. Feeds metadata back into data intelligence cloud
1.5. What is it?
1.5.1. Sparkcluster with a machine learning brain
1.5.1.1. A Spark cluster is a combination of a Driver Program, Cluster Manager, and Worker Nodes that work together to complete tasks. The SparkContext lets us coordinate processes across the cluster. The SparkContext sends tasks to the Executors on the Worker Nodes to run.
1.5.2. Can be rolled out onto EKS and AKS
1.5.2.1. Amazon Elastic Kubernetes Service (EKS) The most trusted way to start, run, and scale Kubernetes
2. What is Edge?
2.1. Edge is a cluster of Linux servers for accessing and processing data close to where it resides. It helps to connect to data sources and process information within your data landscape.
2.2. Edge enables Collibra Data Intelligence Cloud to safely connect to your data sources hosted in an on-premise or cloud environment. It processes the data source information on the Edge site and sends the process results to Collibra Data Intelligence Cloud.
2.3. Edge consists of three main components:
2.3.1. An Edge configuration page in Collibra Data Intelligence Cloud to create and install Edge sites.
2.3.2. An Edge integration capability repository that resides on the Collibra Platform and contains all capabilities that can run on an Edge site.
2.3.3. An Edge site that is installed close to a data source in the customer's environment, whether it's in the cloud or on the customer's premises.
3. Edge Safety
3.1. Edge is built with security first approach. All communication channels are secured by TLS 1.2 and all endpoints outside Edge are accessible only via authentication.
3.2. Edge does not send or store any customer data, its purpose is to host capabilities that process the data in its own environment and to send only processing results to Collibra Data Intelligence Cloud.
4. Involved in Collibra Edge
4.1. OpenTelemetry
4.1.1. Technical Answer
4.1.1.1. What is OpenTelemetry?
4.1.1.1.1. OpenTelemetry is a vendor-neutral standard way to collect telemetry data for applications, their supporting infrastructures, and services. It’s now promoted to a Cloud Native Computing Foundation incubating project since its inception in May 2019 with the merger of OpenCensus and OpenTracing projects. Most of the standard has reached 1.0 stage. Spans and traces are the most advanced for now, automated instrumentation, and additional languages are in active development, and logs are planned for a later date.
4.1.1.1.2. OpenTelemetry is an important milestone, making it easier for providers and users alike to collect data from a broader set of systems and get a more complete picture of how applications behave and why. Today’s challenge shouldn’t be about getting telemetry data –whether that’s metrics, events, logs, or traces (also known as M.E.L.T.) — but to relating how the infrastructure (whether compute, storage or network) and supporting services (as service meshes) influence the application’s health, and ultimately, the user experiences delivered and the impact they have on business.
4.1.1.1.3. That’s what AppDynamics has been focusing on for years: understanding where problems come from, why they happen and relating how technical problems impact user experiences and business outcomes to set the right priorities of actions. As a consequence, we welcome OpenTelemetry as a data ingestion standard which will make it even easier to get visibility into a broader set of systems and enrich our traditional AI and ML capabilities to help make sense of that vast array of data.
4.1.1.2. OpenTelemetry covers many components, including the following:
4.1.1.2.1. APIs are used to instrument your code to generate traces, i.e. the components parts that make calls and exchange information with other parts. This can be performed via code change or auto-instrumentation agents (which is less mature for now). Most libraries are expected to come with OpenTelemetry capabilities out of the box in the not-too-distant future.
4.1.1.2.2. SDKs to collect such data and pass it to the processing and export stages.
4.1.1.2.3. In-process exporters, running with the application, can translate the telemetry data into custom formats and send directly or through a collector to back-ends, whether Open Source as Jaeger or Zipkin, or from commercial providers. The in-process exporter approach is language-specific and is the main approach used so far since it was the first one to be mature.
4.1.1.2.4. The out-of-process collector is used for data filtering, aggregation, batching, and communication with various telemetry backends. This communication is performed either via vendor-specific exporters or standard OpenTelemetry OTLP exporters.
4.1.2. Different technical answer
4.1.2.1. OpenTelemetry collects several classes of telemetry data, including logs, metrics and traces, and exports them to backend platforms for processing. Analysis of this telemetry data allows teams to bring coherence to multi-layered ecosystems. This makes it far easier to observe the systems’ behavior and address any performance issues.
4.1.2.2. The OpenTelemetry framework includes several components:
4.1.2.2.1. Language-specific OpenTelemetry APIs — Java, Python, JavaScript and more — to instrument code for data collection.
4.1.2.2.2. Exporters to enable the transmission of telemetry data to the backend observability platform of your choice.
4.1.2.2.3. Language-specific OpenTelemetry SDKs to provide a bridge between the APIs and the exporters.
4.1.2.2.4. The OpenTelemetry Collector to provide a vendor-agnostic implementation for receiving, processing and exporting telemetry data.
4.1.3. It collects telemetry data, logs, metrics and traces,
4.2. Minio
4.2.1. It's object storage for the cloud, using Kubernetes. It's really fast.