Probabilty Concept Map

Mind map of probability concepts. Quantitative Reasoning Math 101 college

Probabilty Concept Map
par Tamya Benniefield
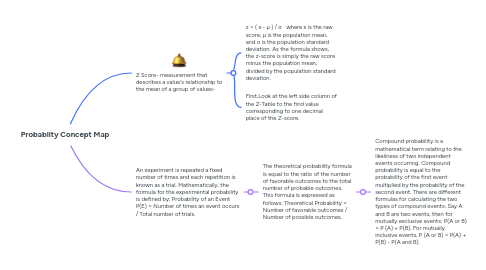
1. Z Score- measurement that describes a value's relationship to the mean of a group of values-
1.1. z = ( x - μ ) / σ where x is the raw score, μ is the population mean, and σ is the population standard deviation. As the formula shows, the z-score is simply the raw score minus the population mean, divided by the population standard deviation.
1.2. First,Look at the left side column of the Z-Table to the find value corresponding to one decimal place of the Z-score.
2. An experiment is repeated a fixed number of times and each repetition is known as a trial. Mathematically, the formula for the experimental probability is defined by; Probability of an Event P(E) = Number of times an event occurs / Total number of trials.
2.1. The theoretical probability formula is equal to the ratio of the number of favorable outcomes to the total number of probable outcomes. This formula is expressed as follows: Theoretical Probability = Number of favorable outcomes / Number of possible outcomes.
2.1.1. Compound probability is a mathematical term relating to the likeliness of two independent events occurring. Compound probability is equal to the probability of the first event multiplied by the probability of the second event. There are different formulas for calculating the two types of compound events: Say A and B are two events, then for mutually exclusive events: P(A or B) = P (A) + P(B). For mutually inclusive events, P (A or B) = P(A) + P(B) - P(A and B).