Unlock the full potential of your projects.
Try MeisterTask for free.
Vous n'avez pas de compte ?
Inscription gratuite
Parcourir
Cartes en vedette
Catégories
Gestion de projet
Objectifs d'affaires
Ressources humaines
Brainstorming et analyse
Marketing et contenu
Éducation et remarques
Loisirs
Vie courante
Technologie
Design
Résumés
Autre
Langues
English
Deutsch
Français
Español
Português
Nederlands
Dansk
Русский
日本語
Italiano
简体中文
한국어
Autre
Montrer carte totale
Copier éditer carte
Copier
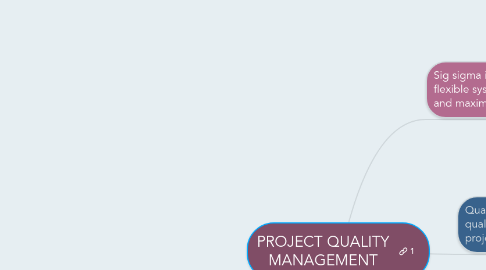
PROJECT QUALITY MANAGEMENT
Autre
nur shafiqah
Suivre
Lancez-Vous.
C'est gratuit
S'inscrire avec Google
ou
s'inscrire
avec votre adresse e-mail
Cartes mentales similaires
Plan de carte mentale
PROJECT QUALITY MANAGEMENT
par
nur shafiqah
1. Sig sigma is "a comprehensive and flexible system for achieving, sustaining, and maximizing business success".
1.1. a)DEFINE: define the problem/opportunity, process, and customer requirement.
1.2. b) MEASURE: Define measure, then collect, compile, and display data.
1.3. c) ANALYZE: Scrutinize process details to find improvement opportunities.
1.4. d) IMPROVE: Generate solutions and ideas for improving the problem
1.5. c) ANALYZE: Scrutinize process details to find improvement opportunities.
2. Quality planning: identifying which quality standards are relevant to the project and how to satisfy them.
3. Quality assurance: periodically evaluating overall project performance to ensure the project will satisfy the relevant quality standard.
3.1. Quality audit - structured review
3.2. Benchmarking - ideas
4. Quality control: monitoring specific project results to ensure that they comply with the relevant quality standard.
4.1. a) cause-and-effect diagrams trace complaints about quality problems back to the responsible production operations.
4.2. b) control chart is a graphic display of data that illustrates the result of process over time.
4.3. c) Run Chart- displays the history and pattern of variation of a process over time.
4.4. d) scatter diagram helps to show if there is a relationship between two variables.
4.5. e) Histogram is a bar graph of a distribution of variables
4.6. f) Pareto chart is a histogram that can help you identify and prioritize problem areas.
4.7. g) Flowcharts are graphic displays of the logic and flow of processes.
4.8. h)Statistical sampling involves choosing part of a population of interest for inspection.
Lancez-vous. C'est gratuit!
Connectez-vous avec Google
ou
S'inscrire