

Population Dynamics
por Yugami Phi Ling Lyka Saiko
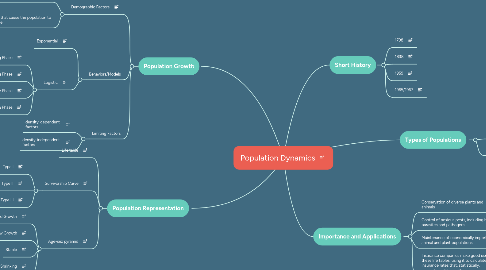
1. Population Representation
1.1. Life table
1.2. Survivorship Curve
1.2.1. Type I
1.2.2. Type II
1.2.3. Type III
1.3. Age-sex pyramid
1.3.1. Rapid Growth
1.3.2. Slow Growth
1.3.3. Stable
1.3.4. Shrinking
2. Population Growth
2.1. Demographic Factors
2.1.1. Factors that cause the population to increase
2.1.1.1. Immigration
2.1.1.2. Birth
2.1.2. Factors that cause the population to decrease
2.1.2.1. Death
2.1.2.2. Emigration
2.2. Behaviors/Models
2.2.1. Exponential
2.2.2. Logistic
2.2.2.1. Lag Phase
2.2.2.2. Log Phase
2.2.2.3. Stationary Phase
2.2.2.4. Death Phase
2.3. Limiting Factors
2.3.1. density-dependent factors
2.3.2. density-independent factors