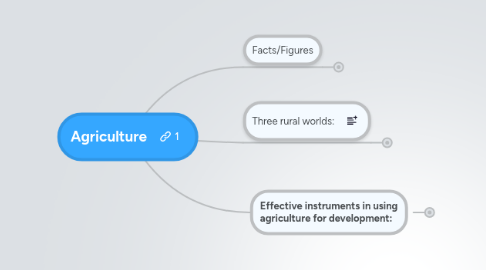
1. Facts/Figures
1.1. 29% of GDP & employs 65% in agri-based countries
1.2. employs 1.3 billion small holders
1.3. out of 3 billion rural dwellers, 2.5b in agric (1.5 in smallholder households)
1.4. decline in poverty (from 28--> 22) attributed to falling rural poverty (37-->29)
1.5. more than 80% of the decline in rural poverty is attributable to better conditions in rural areas than to out-migration of the poor
1.6. accounts for 30% of greenhouse gas emission
2. Three rural worlds:
2.1. Agriculture-based countries
2.2. Transforming countries
2.3. Urbanized countries
3. Effective instruments in using agriculture for development:
3.1. Increase access to assets
3.1.1. Land
3.1.2. Water
3.1.3. Human capital
3.2. Make smallholder farming more productive and sustainable
3.2.1. Improve price incentives and increase the quality and quantity of public investment
3.2.1.1. Taxation
3.2.1.2. Trade policy
3.2.1.3. Cash transfer
3.2.1.4. Subsidy - free electricity
3.2.2. Make product markets work better
3.2.2.1. Food staples market
3.2.2.1.1. Reduce transaction costs; investments in infrastructure, promising innovations (commodity exchanges, MIS - rural radio, warehouse receipts, market-based risk mgmt tools)
3.2.2.1.2. How to manage price volatility for politically sensitive food staples
3.2.2.2. Traditional bulk exports
3.2.2.2.1. Ex: cotton,cocoa, etc
3.2.2.2.2. Need to increase productivity of exports
3.2.2.2.3. Need to have fair trade
3.2.2.2.4. Need to improve quality of products
3.2.2.3. High-value markets
3.2.2.3.1. Ex: Supermarket revolution, fish and fish produts, meat, nuts, fresh and processed fruits and vegetables, spices, and floriculture
3.2.2.3.2. Now 43% of agrofood exports from dev countries
3.2.2.3.3. The poverty impacts: depends on how the rural pop participates in HVM (as producers or through the labor market)
3.2.2.3.4. To improve:
3.2.2.3.5. To improve (policy):
3.2.2.4. Input markets
3.2.2.4.1. low fertilizer use is one of the major constraints in poor countries
3.2.2.4.2. "market smart" approaches
3.2.3. Improve access to financial services and reduce exposure to uninsured risks
3.2.3.1. Farmers face financial constraints
3.2.3.1.1. Lack of asset ownership to serve as collateral (wealth rationing)
3.2.3.1.2. Reticence to put assets at risk as collateral when they are vital to livelihoods (risk rationing)
3.2.3.1.3. State-banks/public programs are discontinued and void is not filled by numerous institutional innovations
3.2.3.2. Rural finance
3.2.3.2.1. provides access to credit w/o formal collateral
3.2.3.2.2. mostly women
3.2.3.2.3. BUT hasn't reached most agric activities - only for those with high turnovers (such as small livestock, horticulture)
3.2.3.2.4. Range of products has increased
3.2.3.2.5. New ones
3.2.3.3. Managing risks
3.2.3.3.1. risks:
3.2.3.3.2. Approaches to mitigate/manage risks for smallholders
3.2.4. Promote innovation through science and technology
3.2.4.1. R&D data
3.2.4.1.1. developing countries = 1/9 that of dev countries R&D share of agric GDP
3.2.4.1.2. IRR of 43%
3.2.4.1.3. Large increases in India and China - 3x over past 20 years
3.2.4.2. Barriers
3.2.4.2.1. FINANCE: Low investment in R&D
3.2.4.2.2. PUBLIC SYSTEM CAPACITY: Public research org face serious leadership, mgmt, financial constraints that require urgent attention
3.2.4.2.3. ECON-GEO: CHallenge of narrowing the income and productivity gaps between favored and less-favored regions
3.2.4.2.4. PRIVATE INTEREST: Advances in biotech led by private sector with commercial interests, hence do not reach smallholders
3.2.4.2.5. GMO RESTRAINS: Low public investment in biotech and slow progress in regulating possible env and food safety risks have restrained dev of GMOs
3.2.4.3. Positives
3.2.4.3.1. IN higher-value markets, private sector innovate along the value chain; which requires PPP
3.2.5. Make agriculture more sustainable and a provider of env services
3.2.5.1. Agric intensification effects on env:
3.2.5.1.1. reduced biodiversity
3.2.5.1.2. mismanaged irrigation water
3.2.5.1.3. agrochemical pollution
3.2.5.1.4. health costs and deaths from pesticide posioning
3.2.5.2. Livestock revolutions' costs on env:
3.2.5.2.1. spread of disease (avian flu)
3.2.5.2.2. deforestation, soil erosion, desertification and degradation of pastures and watersheds
3.2.5.3. Approaches
3.2.5.3.1. Seek more sustainable prod systems
3.2.6. enhance the performance of producer organizations
3.2.6.1. Importance of collective action:
3.2.6.1.1. reduce transaction costs
3.2.6.1.2. achieve some market power
3.2.6.1.3. increase representation in national and international policy forums
3.2.6.1.4. to achieve competitiveness
3.2.6.2. Data:
3.2.6.2.1. 1982-2002: 8 to 65% Senegal
3.2.6.2.2. Dairy coop in india 12.3m members
3.2.6.3. Barriers
3.2.6.3.1. Legal restrictions
3.2.6.3.2. Low managerial capacity
3.2.6.3.3. Elite capture
3.2.6.3.4. Exclusion of the poor
3.2.6.3.5. Failure to be recognized as full partners by the state
3.2.6.4. Approaches
3.2.6.4.1. Donors and govt can facilitate the right to organize
3.2.6.4.2. Training leaders
3.2.6.4.3. Empowering weaker members
3.2.6.4.4. Providing this assistance w/o creating dependency
