Unlock the full potential of your projects.
Try MeisterTask for free.
Não tem uma conta?
Criar conta gratuita
Navegar
Mapas em destaque
Categorias
Gerenciamento de projetos
Negócios e metas
Recursos Humanos
Brainstorming e Análise
Marketing e Conteúdo
Educação e Notas
Entretenimento
Vida
Tecnologia
Design
Resumos
Outro
Idiomas
English
Deutsch
Français
Español
Português
Nederlands
Dansk
Русский
日本語
Italiano
简体中文
한국어
Outro
Exibir mapa completo
Copiar e editar mapa
Copiar
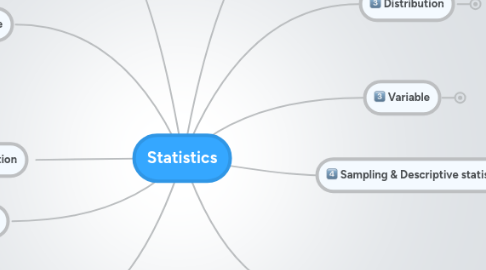
Statistics
Outro
JC
Juan C Hernandez
Seguir
Statistics Overview
Começar.
É Gratuito
Cadastrar-se com Google
ou
inscrever-se
com seu endereço de e-mail
Mapas mentais semelhantes
Esboço do mapa mental
Statistics
por
Juan C Hernandez
1. ANOVA
2. Contingency table
2.1. contingency table
2.2. mosaic plot
2.3. test of independance
2.4. test of homogeneity
3. Regression & Correlation
3.1. simple linéar regression
3.2. evaluating linear fits
3.3. multiple linear regression
3.4. correlation
3.5. correlation and causation
4. Hypothesis test
4.1. Hypothesis testing
4.2. One sample t test
4.3. Z test
4.4. confidence interval
4.5. Paired T Test
4.6. Two Sample T test
4.7. one-tailed and two-tailed tests
4.8. procedure of hypothesis testing
4.9. decision errors
4.10. Power analysis
4.11. explanation on output of t test
5. Central limit theorem
6. Probability & Probability Law
6.1. Probability
6.2. Probability Law
6.3. Random Variable
6.4. Probability distribution (discrete case)
6.5. Probability distribution (continuous case)
7. Distribution
7.1. Binomial Distribution
7.2. Poisson
7.3. Geometric
7.4. Negative binomial
7.5. Normal Distribution
7.6. Score
7.7. Student t
7.8. exponential
7.9. Chi-Square
7.10. Snedecor's F
8. Variable
8.1. Data Set
8.2. Variable Type
9. Sampling & Descriptive statistics
9.1. Sample and Population
9.2. Descriptive statistics
9.3. Population mean vs Sample mean
9.4. Population variance vs Sample variance
9.5. Quantiles
9.6. Box Plot
10. Representing data
10.1. Frequency table
10.2. Dotplot
10.3. Jittered Strip Plot
10.4. Stem and Leaf Plot
10.5. Histograms
10.6. Bar Chart
10.7. Shape of Frequency Distribution
Comece Já. É grátis!
Conectar-se com Google
ou
Inscrever-se