

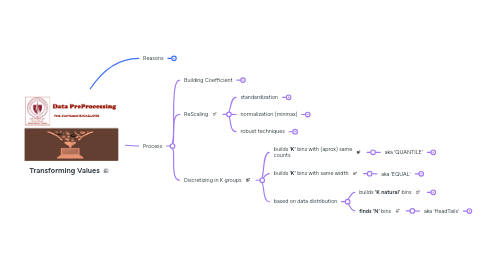
1. Reasons
1.1. outliers
1.2. Different units of measurements (after merging)
1.3. Different ranges
2. Process
2.1. Building Coefficient
2.1.1. density
2.1.2. ratio
2.1.3. proportion
2.1.4. Average
2.2. ReScaling
2.2.1. standardization
2.2.1.1. mean of 0 and a standard deviation of 1 for all variables (all adimensional)
2.2.1.2. sensitive to outliers
2.2.2. normalization (minmax)
2.2.2.1. scales numerical features to a specific range, usually between 0 and 1
2.2.2.2. sensitive to outliers
2.2.3. robust techniques
2.2.3.1. Like standardizing, but uses the median instead of mean, and interquartile range (IQR) instead of standard deviation
2.2.3.1.1. good in the presence of outliers
2.2.3.2. does not work if quartiles 1 and 3 are the same.
2.3. Discretizing in K groups
2.3.1. builds **'K'** bins with (aprox) same counts
2.3.1.1. aka 'QUANTILE'
2.3.1.1.1. performance when OUTLIERS
2.3.1.1.2. Its Best
2.3.1.1.3. Its Worst
2.3.2. builds **'K'** bins with same width
2.3.2.1. aka 'EQUAL'
2.3.2.1.1. performance when OUTLIERS
2.3.2.1.2. Its Best
2.3.2.1.3. Its Worst
2.3.3. based on data distribution
2.3.3.1. builds **'K natural'** bins
2.3.3.1.1. aka 'Fisher-Jenks'
2.3.3.2. **finds 'N'** bins
2.3.3.2.1. aka 'HeadTails'