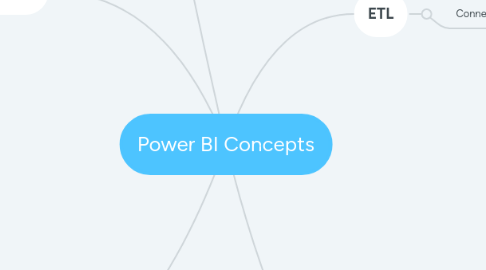
1. Modelling
1.1. DAX
1.1.1. DAX Guide
1.1.2. MS DAX Intro https://docs.microsoft.com/en-us/power-bi/guided-learning/introductiontodax
1.1.3. Playlist https://www.youtube.com/playlist?list=PL1myWUzvmmDGmLfty3BDluz8nzme1dZxg
1.1.4. Free Course https://www.sqlbi.com/p/introduction-to-data-modeling-for-power-bi-video-course/
1.1.5. Learn Excel formulae
1.1.6. Learn aggregation functions
1.1.7. Learn X Aggregations
1.1.8. RELATED (...)
1.2. Design
1.2.1. Showing actuals and forecasts in the same chart with Power BI - SQLBI
2. Visualisation
2.1. Built-in Visuals
2.1.1. Navigation
2.1.1.1. Slicers
2.1.1.2. Bookmarks
2.1.2. Display
2.1.2.1. Visualization types in Power BI - Power BI
2.1.2.2. Key Visuals
2.1.2.2.1. Matrix
2.1.2.2.2. Bar
2.1.2.2.3. Line
2.1.2.2.4. Card
2.1.2.2.5. KPI
2.2. Marketplace
2.2.1. Certified Power BI custom visuals - Power BI
2.3. Custom
2.3.1. R
2.3.2. Python
2.3.3. JavaScript
2.3.3.1. Power BI Custom Visuals
3. General Resources
3.1. Syncfusion Free Ebooks | Power BI Succinctly
3.2. Guy in a Cube Channel - https://www.youtube.com/channel/UCFp1vaKzpfvoGai0vE5VJ0w
3.3. Power BI Channel - https://www.youtube.com/channel/UCy--PYvwBwAeuYaR8JLmrfg
3.4. https://www.sqlbi.com/
3.5. https://powerpivotpro.com/
4. ETL
4.1. Connections
4.1.1. Built-in
4.1.1.1. Learn through experiment
4.1.2. Custom
4.1.2.1. "M" Language
4.1.2.1.1. https://www.youtube.com/watch?v=ecfRTEoYadI
4.1.2.1.2. Power BI for the Developer | Peter Myersamp;
4.1.2.1.3. M is for Data Monkey https://www.amazon.com/Data-Monkey-Guide-Language-Excel/dp/1615470344
4.1.2.2. Web Services
4.1.2.2.1. Working with web services in Power Query/Excel and Power BI
4.1.2.2.2. Web API Data Sources with Power Query and Scheduling Data Refresh in the Power BI Service
4.1.3. Dataflows
4.1.3.1. Introducing: Power BI data prep with dataflows
5. Publication
5.1. powerbi.com
5.1.1. export
5.1.1.1. pdf
5.1.1.2. powerpoint
5.2. export
5.2.1. pdf

