

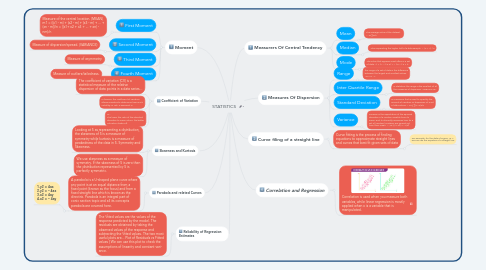
1. Moment
1.1. First Moment
1.1.1. Measure of the central location. (MEAN) m1 = ((x1 - m) + (x2 - m) + (x3 - m) + ... + (xn - m))/n = ((x1+ x2 + x3 + ... + xn) - nm)/n
1.2. Second Moment
1.2.1. Measure of dispersion/spread. (VARIANCE)
1.3. Third Moment
1.3.1. Measure of asymmetry.
1.4. Fourth Moment
1.4.1. Measure of outliers/tailedness.
2. Reliability of Regression Estimates
2.1. The \ftted values are the values of the response predicted by the model. The residuals are obtained by taking the observed values of the response and subtracting the \ftted values. The two most useful plots are... Plot of Residuals vs Fitted values { We can use this plot to check the assumptions of linearity and constant vari- ance.
3. Coefficient of Variation
3.1. The coefficient of variation (CV) is a statistical measure of the relative dispersion of data points in a data series...
3.2. In finance, the coefficient of variation allows investors to determine how much volatility, or risk, is assumed in
3.3. in... The lower the ratio of the standard deviation to mean return, the better risk-return trade-off.
4. Skewness and Kurtosis
4.1. Looking at S as representing a distribution, the skewness of S is a measure of symmetry while kurtosis is a measure of peakedness of the data in S. Symmetry and Skewness.
4.2. We use skewness as a measure of symmetry. If the skewness of S is zero then the distribution represented by S is perfectly symmetric.
5. Parabola and related Curves
5.1. A parabola is a U-shaped plane curve where any point is at an equal distance from a fixed point (known as the focus) and from a fixed straight line which is known as the directrix. Parabola is an integral part of conic section topic and all its concepts parabola are covered here.
5.1.1. 1.y2 = 4ax 2.y2 = – 4ax 3.x2 = 4ay 4.x2 = – 4ay
6. Measurers Of Central Tendency
6.1. Mean
6.1.1. The average value of the dataset. :- x=∑xi/n
6.2. Median
6.2.1. Value separating the higher half of a data sample :- (n + 1) / 2
6.3. Mode
6.3.1. The value that appears most often in a set of data. :-l + f 1 − f 0 2 f 1 − f 0 − f 2 × h
7. Measures Of Dispersion
7.1. Range
7.1.1. the range of a set of data is the difference between the largest and smallest values. :-R = H - L
7.2. Inter Quartile Range
7.2.1. In Statistics, the range is the smallest of all the measures of dispersion.:-IQR=Q3−Q1
7.3. Standard Deviation
7.3.1. is a measure that is used to quantify the amount of variation or dispersion of a set of data values. :- σ=√ ∑(X−μ)2/n
7.4. Variance
7.4.1. variance is the expectation of the squared deviation of a random variable from its mean, and it informally measures how far a set of (random) numbers are spread out from their mean. :- Var (X) = E[( X – μ)2]
8. Curve filing of a straight line
8.1. Curve fitting is the process of finding equations to approximate straight lines and curves that best fit given sets of data
8.1.1. For example, for the data of Figure 12.1, we can use the equation of a straight line