
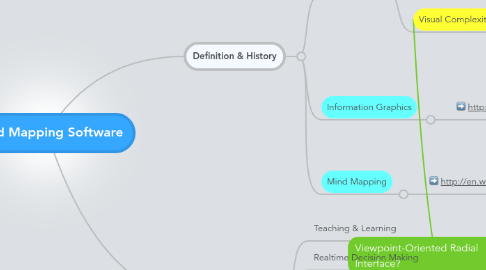
1. Definition & History
1.1. Radial Tree
1.1.1. http://en.wikipedia.org/wiki/Radial_tree
1.1.1.1. "A radial tree, or radial map, is a method of displaying a tree structure (e.g., a tree data structure) in a way that expands outwards, radially. It is one of many ways to visually display a tree.,[2][3] with examples extending back to the early 20th century.[4] In use, it is a type of information graphic."
1.1.2. Visual Complexity: Radial Tree Viewer
1.1.2.1. http://www.visualcomplexity.com/vc/project.cfm?id=26
1.1.2.2. "This tool is an extended version of the Radial Tree Browser. The original version was developed by Jason Baumgartner and Nihar Sheth and is an integral part of the Information Visualization Software Repository (IV repository) at Indiana University."
1.2. Information Graphics
1.2.1. http://en.wikipedia.org/wiki/Information_graphics
1.2.1.1. "Information graphics or infographics are graphic visual representations of information, data or knowledge intended to present complex information quickly and clearly.[1][2] They can improve cognition by utilizing graphics to enhance the human visual system’s ability to see patterns and trends.[3][4] The process of creating infographics can be referred to as data visualization, information design, or information architecture.[2]"
1.2.1.1.1. data visualization
1.2.1.1.2. information design
1.2.1.1.3. information architecture
1.2.1.1.4. Mark Smiciklas (2012). The Power of Infographics: Using Pictures to Communicate and Connect with Your Audience.
1.3. Mind Mapping
1.3.1. http://en.wikipedia.org/wiki/Mind_map
1.3.1.1. "A mind map is a diagram used to visually outline information. A mind map is often created around a single word or text, placed in the center, to which associated ideas, words and concepts are added. Major categories radiate from a central node, and lesser categories are sub-branches of larger branches.[1] Categories can represent words, ideas, tasks, or other items related to a central key word or idea."
2. Applications
2.1. Teaching & Learning
2.2. Realtime Decision Making
2.3. Scalable Vector Graphics and Other Online-Oriented Interfaces to Information
2.4. -
2.5. Theatre in the Sphere (TITS): Presentation Space Interface Systems
2.5.1. 1