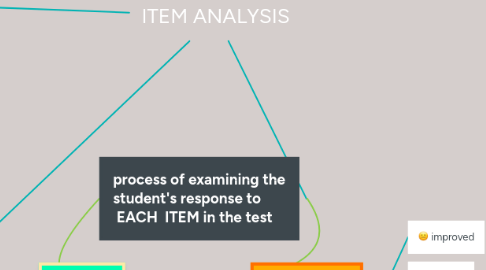
ITEM ANALYSIS
by J Lo


1. TERMS: UPPER GROUP (UG) -- Students who performed well in the test LOWER GROUP (LG) -- students who got the lowest scores in the test Distracter -incorrect option
2. PURPOSE of Item Analysis
2.1. To improve the quality of assessment tools - identify defects - detect learning difficulties of the class as a whole - identify areas of weaknesses - increase skill in test construction
3. "GOOD" items
3.1. Retained
4. How to solve for Quantitative Item Analysis
4.1. FOLLOW THESE STEPS: 1. Arrange the test scores from highest to lowest. 2. Include only in the analysis of item the upper 30% and lower 30% of the total number whom you tried the test. 3. Do not include the middle part of the test takers. 4. Compute the difficulty Index 5. Compute the discrimination Index 6. Decide whether the item will be eliminated 7. Decide if the distracter be eliminated
5. Qualitative Analysis
5.1. Checking the quality of the test by: > proofreading( grammar, spelling errors) > verbal feedback from students/teachers
6. process of examining the student's response to EACH ITEM in the test
7. can be found out through
8. Difficulty Index
8.1. Difficulty Index will determine how easy the item was
8.2. formula: number of students selecting the correct answer Df=______________________________________________ TOTAL number of students
8.3. Table 1: Index of difficulty of an item Index Range Difficulty Level 0.00 – 0.20 Very difficult 0.21 – 0.80 Average Above 80 Easy
8.4. Table 2: Index Range and Decision Index Range Decision 0.00 - 0.20 REJECT 0.21 – 0.80 ACCEPT 0.81 – 1.0 REVISE
9. "DEFECTIVE" items
9.1. improved
9.2. revised
9.3. rejected
10. Quantitative Analysis
10.1. Use of numerical data to analyze each item in the test
10.2. Today's Goal: 1. Steps for solving QA 2. Difficulty Index 3. Discrimination Index 4. Distracter Attractiveness
11. Discrimination Index
11.1. "power" of an item to discriminate/identify between the students who know the lesson and those who don't know the lesson
11.2. Usually, a good item properly discriminates bright students from poor ones
11.3. THREE TYPES of discrimination indexes:
11.4. 1. Positive Discrimination Index- those who did well on the overall test chose the correct answer for the particular item more often than those who did poorly.
11.4.1. more students in the "upper group" got the test item correctly
11.4.2. Index of Discrimination and Decision Index Range (Decision) Discriminating level 0.19 and Below (Reject)Poor item, to be rejected or revised 0.20-0.29 (Revise)Marginal item, subject to improvement 0.30 – 0.39 (Revise)Reasonably good item but possibly subject to improvement 0.40- 1.0 (RETAIN) Very good item
11.5. 2. Negative Discrimination Index those who did poorly on the over all test chose the correct answer for a particular item more often that those who did well on the overall test.
11.5.1. more from the "lower group" selected the correct answer
11.5.2. ITEM IS REJECTED
11.6. 3. Zero discrimination index those who did well and those who did poorly on the overall test chose the correct answer for a particular item with "equal" frequency.
11.6.1. equal number in UG and LG selected the correct answer. Therefore , the item cannot distinguish good vs poor performers in the test
11.6.2. ITEM IS REJECTED
