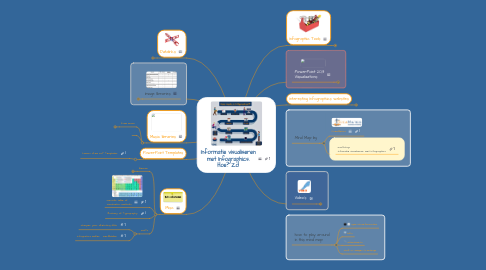
1. Datalinks
1.1. IMLS Public Library Comparison
1.2. Pew Internet Data Sets
1.3. Census Data – Local Scoping
1.4. US Government Data
1.5. Google Public Data
2. Image libraries
2.1. Pixabay
2.2. WikiMedia Commons
2.3. The Noun Project
2.4. Death to the Stockphoto
2.5. Little Visuals
2.6. New Old Stock
2.7. Freepik
2.8. Flickr
2.9. Advanced Google Image Search
2.10. 123 RF
2.11. iStock (one free per week)
2.12. Morgueflie
2.13. Picography
2.14. Public Domain Pictures
2.15. Stokpic
2.16. Designers Pics
2.17. Dreams Time
2.18. Gratisography
2.19. Image Base
2.20. ISO Republic
2.21. Kaboom Pics
2.22. Life of Pix
2.23. Unsplash
2.24. Barn Images
3. Music libraries
3.1. free music
3.1.1. Opuzz
3.2. ...
4. PowerPoint Templates
4.1. Leawo Free PPT Templates
5. Misc
5.1. Kleuren
5.1.1. Adobe Color Wheel
5.1.2. Design Seeds
5.1.3. Color Picker Chrome Extension
5.1.4. Coolors
5.2. Periodic table of visualization methods
5.3. Anatomy of Typography
5.4. PDF's
5.4.1. Sharpen your sketching skills
5.4.2. Infograhics maken - werkbladen
6. Infographic Tools
6.1. Canva
6.2. Easelly
6.2.1. Plus
6.2.1.1. Vhemes zorgen ervoor dat je infographic er niet scattered uitziet
6.2.1.2. infographics die je hier maakt lijken op degene die je online tegenkomt
6.2.2. Min
6.2.2.1. gratis account is zeer beperkt vergeleken met Piktochart
6.2.2.2. Vhemes kunnen beperkend werken vergeleken met Piktochart
6.2.2.3. geen keyboard controls en mider intuitief design
6.3. Visme
6.4. Piktochart
6.4.1. Plus
6.4.1.1. speciaal voor infographics
6.4.1.2. gebruikersvriendelijk
6.4.1.3. veel clip-arts
6.4.2. Min
6.4.2.1. geen guidelines of themes, alleen voorbereide infographics
6.4.2.2. begrenst tot 20 image uploads bij een gratis account (200 bij betaald account)
6.5. Infogram
6.5.1. Plus
6.5.1.1. fun en dynamische manier om kwantitatieve en/of live data weer te geven
6.5.1.2. embedden van je infogram met een gratis account
6.5.2. Min
6.5.2.1. betaald account nodig om bestand te downloaden
6.5.2.2. beperkt tot kwantitatieve data
6.6. Infoactive
6.6.1. Plus
6.6.1.1. visuele live data weergave
6.6.1.2. geinspireerd door visual design, aangenaam om naar te kijken
6.6.2. Min
6.6.2.1. slechts drie infographics met een gratis account
6.7. ThingLink
6.7.1. Plus
6.7.1.1. onbeperkte upload van afbeeldingen, ook bij gratis account
6.7.1.2. embed codes en directe links naar websites of om te mailen naar b.v. deelnemers
6.7.1.3. heeft trainer en studenten accounts met aangepaste functionaliteit
6.7.2. Min
6.7.2.1. heeft geen groot fun-gehalte om aandacht te trekken
6.7.2.2. je moet voor je eigen images zorgen
6.7.2.3. bij een gratis account kun je je bestand niet exporteren
