

1. Service Operation
1.1. Added Value
1.1.1. Service operation also manages the technology that is used to deliver and support services
1.1.2. Through the service operation lifecycle stage the business directly sees and receives value from IT
1.2. Service Operation Processes (5)
1.2.1. Request Fulfillment
1.2.2. Access Management
1.2.3. Event Management
1.2.4. Incident Management
1.2.4.1. KPIs
1.2.4.1.1. Mean Time to Repair (MTTR)
1.2.4.1.2. % of outage due to incidents (unplanned unavailability)
1.2.4.1.3. % of incidents solved within deadline/target
1.2.4.1.4. Average incident response time
1.2.4.1.5. % incidents solved within SLA time
1.2.4.1.6. Mean Time To Detect (MTTD)
1.2.4.1.7. % of repeat incidents
1.2.4.1.8. % of reopened incidents
1.2.4.1.9. % of overdue incidents
1.2.4.1.10. Incident queue rate
1.2.4.1.11. Average # of incidents handled by each first line operatives
1.2.4.1.12. Average incident closure duration
1.2.4.1.13. Average cost to solve an incident
1.2.4.1.14. Old incident backlog
1.2.4.1.15. Incidents completed without escalation
1.2.4.1.16. % of incidents fixed before users notice
1.2.4.1.17. % of incidents resolved remotely
1.2.4.1.18. Average incidents solved by FLM
1.2.4.1.19. % of incidents which change classification during the lifecycle
1.2.4.1.20. % of unmodified/neglected incidents
1.2.4.1.21. % of incidents which change prio during the lifecycle
1.2.4.1.22. Average number of (re)-assignments of incidents
1.2.4.1.23. % of incorrectly assigned incidents
1.2.4.1.24. Major Event Incident - Mean Time to Restore Service
1.2.4.1.25. Number of Incidents logged with no diagnosis provided in the Incident description
1.2.4.1.26. % of incidents by source
1.2.4.1.27. % of incident that lost OLA in identify process (MTTI)
1.2.4.1.28. Average deviation of deadline incidents
1.2.4.1.29. Efforts required for impact assessment of an incident, change
1.2.4.1.30. Incident backlog
1.2.4.1.31. Number of incidents caused by deficient user training
1.2.5. Problem Management
1.2.5.1. KPIs
1.2.5.1.1. Average problem closure duration
1.2.5.1.2. Problem backlog
1.2.5.1.3. Problem queue rate
1.2.5.1.4. % of problems with a root cause identified
1.2.5.1.5. % of problems with a root cause analysis
1.2.5.1.6. % of overdue problems
1.2.5.1.7. % of unmodified/neglected problems
1.2.5.1.8. Ratio of number of incidents versus number of problems
1.2.5.1.9. % of problems resolved within the required time period
1.2.5.1.10. Average cost to solve a problem
1.2.5.1.11. % of problems with available workaround
1.2.5.1.12. Number of business disruptions caused by problems
1.2.5.1.13. Number of Incidents per Problem
1.2.5.1.14. Number of Incidents per Known Problem
1.2.5.1.15. Time until Problem Identification
1.2.5.1.16. Number of repeated incidents
1.2.5.1.17. Balance of Problems solved with a KE - RFC or other
1.3. Service Operations Documentation
1.3.1. Service Operation Policies and Plans
1.3.2. Operational Requirements
1.3.3. Event Management Policy, Plans and Reports
1.3.4. Incident Management Policy, Plans and Reports
1.3.5. Incident Models
1.3.6. Major Incident Procedure
1.3.7. Request Fulfillment Policy, Plans and Reports
1.3.8. Request Models
1.3.9. Problem Management Policy, Plans and Reports
1.3.10. Problem Models
1.3.11. Information Security Policy, Plans, Classification, Controls and Reports
1.3.12. Service Operations Processes
1.3.13. Technical Documentation
1.3.14. Operational Procedures and Instructions
1.3.15. Functional Documentation
1.3.16. User Guides
1.4. ITIL Functions
1.4.1. Service Desk
1.4.1.1. KPIs
1.4.1.1.1. Number of complaints
1.4.1.1.2. % of customers given satisfaction surveys
1.4.1.1.3. Average number of calls / service request per handler
1.4.1.1.4. First-call resolution rate
1.4.1.1.5. % of calls answered within set timeframe
1.4.1.1.6. % of service requests resolved within an agreed-upon period of time
1.4.1.1.7. % of first-line resolution of service requests
1.4.1.1.8. % of reopened service requests
1.4.1.1.9. % of overdue service requests
1.4.1.1.10. Abandon rate of incoming phone calls
1.4.1.1.11. Average speed to answer phone call
1.4.1.1.12. First line service request closure rate
1.4.1.1.13. Service request queue rate
1.4.1.1.14. % of cases linked to a Knowledgebase Article
1.4.1.1.15. % of tickets closed without Request
1.4.1.1.16. % of Service Desk Availabilty
1.4.1.1.17. % of callers given satisfaction surveys
1.4.1.1.18. % of resolved calls that have not been closed
1.4.1.1.19. Service Call Abandoned Rate
1.4.1.1.20. % of open service requests unmodified/neglected
1.4.1.1.21. % of service requests closed before deadline
1.4.1.1.22. % of unowned open service requests
1.4.1.1.23. % of calls transferred
1.4.1.1.24. Average after call work time
1.4.1.1.25. % of incorrectly assigned service requests
1.4.1.1.26. Average number of (re)-assignments of service requests
1.4.1.1.27. % of escalated service requests
1.4.1.1.28. % of workarounds to service requests applied
1.4.1.1.29. Costs of operating call center / service desk
1.4.1.1.30. % of service requests posted via web (self-help)
1.4.1.1.31. Average overdue time of overdue service requests
1.4.1.1.32. Average service request closure duration
1.4.1.1.33. Service request closure duration rate
1.4.1.1.34. % of open service requests worked on
1.4.1.1.35. Service request backlog
1.4.1.1.36. Customer satisfaction (index)
1.4.1.1.37. Email Backlog
1.4.1.1.38. Number of compliments
1.4.1.1.39. Number of training calls handled by the service desk
1.4.2. Technical Management
1.4.3. Application Management
1.4.4. Operations Management
1.4.4.1. IT Operations Control
1.4.4.2. Facilities Management
2. Continual Service Improvement
2.1. Added Value
2.1.1. Identifies the business objectives and benefits of the improvements
2.1.2. Evaluate and improve the quality of services, the overall maturity of the IT service provider organization and defined processes
2.1.3. Mechanisms may be subject to continuous improvement services, processes, procedures, stages of life services (including CSI)
2.2. Continual Service Improvement Processes
2.2.1. Seven Steps Improvment
2.3. Continual Service Improvement Documentation
2.3.1. Continual Service Improvement Policies and Plans
2.3.2. Corporate and IT Vision, Mission, Goals and Objectives
2.3.3. Critical Success Factors (CSFs)
2.3.4. Key Performance Indicators (KPIs) and Metrics and Achievements
2.3.5. Service Level Targets and Achievements
2.3.6. Balanced Scorecard
2.3.7. Service Improvement Plans (SIPs)
2.3.8. Business Cases
2.3.9. Reporting Policies and Rules
2.3.10. Reports and Dashboards
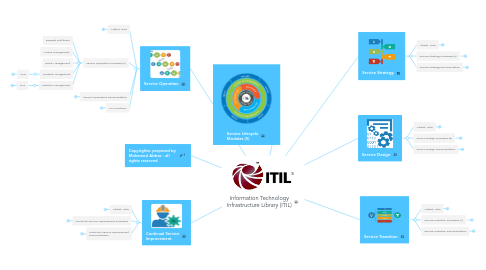
3. Service Lifecycle Modules (5)
4. Copyrights: prepared by Mohamed Abbas - all rights reserved
5. Service Design
5.1. Added Value
5.1.1. Reduces or optimizes Total Costs of Ownership (TCO)
5.1.2. Improved quality and consistency of services
5.1.3. Implementation of new or changed services is better prepared and easier
5.1.4. Improved service alignment
5.1.5. More effective service performance
5.1.6. Improved IT Governance
5.1.7. More effective service management and processes
5.1.8. Improved decision making
5.2. Service Design Processes (8)
5.2.1. Service Catalogue Management
5.2.2. Availability Management
5.2.2.1. KPIs
5.2.2.1.1. Availability (excluding planned downtime)
5.2.2.1.2. % of outage due to changes (planned unavailability)
5.2.2.1.3. % of outage due to incidents (unplanned unavailability)
5.2.2.1.4. % of unplanned outage/unavailability due to changes
5.2.2.1.5. % of Service Desk Availabilty
5.2.2.1.6. % of availability SLAs met
5.2.2.1.7. % of (critical) infrastructure components with automated availability monitoring
5.2.2.1.8. % of critical business processes not covered by a defined service availability plan
5.2.2.1.9. Critical-time failures
5.2.2.1.10. Critical-time outage
5.2.2.1.11. Number of business disruptions caused by problems
5.2.3. Information Security Management
5.2.3.1. KPIs
5.2.3.1.1. % of obsolete user accounts
5.2.3.1.2. % of security-related service calls
5.2.3.1.3. Time lag between detection, reporting and acting upon security incidents
5.2.3.1.4. Number of incidents outside hours where security staff are present
5.2.3.1.5. % of internal hosts which are centrally managed & protected
5.2.3.1.6. Cost of security incidents
5.2.4. Service Level Management
5.2.4.1. KPIs
5.2.4.1.1. % of services covered by SLA
5.2.4.1.2. % of vendor services delivered without agreed service targets
5.2.4.1.3. % of fully documented SLAs
5.2.4.1.4. % of delivered services not in the service catalogue
5.2.4.1.5. % of SLAs without service level breaches
5.2.4.1.6. % of reviewed SLAs
5.2.4.1.7. % of SLAs under Review
5.2.4.1.8. % on-time service level changes
5.2.4.1.9. % of SLAs in renegotiation
5.2.4.1.10. % of SLAs requiring changes
5.2.4.1.11. % of service levels (in SLAs) that are actually measured
5.2.4.1.12. % of service levels (in SLAs) reported in an automated way
5.2.4.1.13. % of SLA reviews conducted on-time
5.2.4.1.14. % of SLA breaches caused by underpinning contracts
5.2.4.1.15. % of SLAs with an assigned account manager
5.2.4.1.16. Average delay in SLAs review
5.2.4.1.17. Average penalty costs per SLA
5.2.4.1.18. Total service delivery penalties paid
5.2.4.1.19. Number of outstanding actions of last SLA review
5.2.5. Capacity Management
5.2.5.1. KPIs
5.2.5.1.1. % of network bandwidth used
5.2.5.1.2. % of response-time SLAs not met
5.2.5.1.3. % of CIs monitored for performance
5.2.5.1.4. % of service requests due to poor performance
5.2.5.1.5. % of CIs with under-capacity
5.2.5.1.6. % of time when Capacity resources are being used below expected
5.2.5.1.7. % of unplanned purchases due to poor performancec
5.2.5.1.8. % of CIs included in capacity reviewsc
5.2.5.1.9. Cost of producing Capacity Plans
5.2.5.1.10. Average time spent on Capacity Plans
5.2.5.1.11. Average time between updates of Capacity Plan
5.2.5.1.12. Number of alerts on exceeding system capacity thresholds
5.2.5.1.13. Number of SLA breaches due to poor performance
5.2.5.1.14. Resolution Time of Capacity Shortage
5.2.5.1.15. Capacity plans evaluated
5.2.5.1.16. Number of Incidents Caused By Inadequate Capacity
5.2.5.1.17. Accuracy of expenditure as defined in Capacity Plan
5.2.5.1.18. Costs associated to unplanned purchases to resolve poor performance
5.2.6. Supplier Management
5.2.7. IT Service Continuity Management
5.2.7.1. KPIs
5.2.7.1.1. % of services not covered in Continuity Plan
5.2.7.1.2. Frequency of review of IT continuity plan
5.2.7.1.3. Average time between updates of Continuity Plan
5.2.7.1.4. % of Business Processes with Continuity Agreements
5.2.7.1.5. Cost of producing Continuity Plans
5.2.7.1.6. Average time spent on Continuity Plans
5.2.7.1.7. IT Service Continuity Plan testing failures
5.2.7.1.8. Accuracy of expenditure as defined in Continuity Plan
5.2.7.1.9. % of discovered issues that have been successfully corrected and tested
5.2.8. Design Coordination
5.3. Service Design Documentation
5.3.1. Service Design Policies and Plans
5.3.2. Service Definitions
5.3.3. Service Acceptance Criteria (SAC) and Service Level Requirements (SLR)
5.3.4. Service Catalogues
5.3.5. Service Design Package (SDP)
5.3.6. Solution Designs
5.3.7. Architectures & Standards
5.3.8. Processes
5.3.9. Measurement and Metrics
5.3.10. Service level agreements (SLA), Contracts and operational level agreements (OLA)
5.3.11. Service Reports
5.3.12. Service Improvement Plan (SIP)
5.3.13. Availability Policy, Plans, Design Criteria, Risk Analysis and Reports
5.3.14. Capacity Policy, Plans, Workload Analysis, Forecasts and Reports
5.3.15. Business and IT Service Continuity Policy, Strategy, Plans, Risk and Business Impact Analysis and Reports
5.3.16. Business and Information Security Policy, Strategy, Plans, Risk Analysis, Classification, Controls and Reports
5.3.17. Supplier and Contracts Policy, Strategy, Plans and Reports
5.3.18. RACI Matrix
6. Service Transition
6.1. Added Value
6.1.1. Ensures that new, modified or retired services meet the expectations of the business as documented in the service strategy and service design stages of the lifecycle
6.1.2. Ensures that all changes in IT services are planned, managed and implemented in a production environment
6.1.3. Ensures that the transition processes are streamlined, effective and efficient and the risks involved are minimized
6.2. Service Transition Processes (7)
6.2.1. Transition Planning and Support
6.2.2. Change Management
6.2.2.1. KPIs
6.2.2.1.1. % of outage due to changes (planned unavailability)
6.2.2.1.2. % of unplanned outage/unavailability due to changes
6.2.2.1.3. % of unauthorized implemented changes
6.2.2.1.4. % of changes that cause incidents
6.2.2.1.5. % of backed-out changes
6.2.2.1.6. % of urgent changes
6.2.2.1.7. % of changes scheduled outside maintenance window
6.2.2.1.8. % of backlogged/neglected change requests
6.2.2.1.9. % of changes initiated by customers
6.2.2.1.10. % of delivered changes implemented within budget/costs
6.2.2.1.11. % of implemented changes not approved (by management / CAB)
6.2.2.1.12. Change queue rate
6.2.2.1.13. % of overdue changes
6.2.2.1.14. Lead Time To Change Execution
6.2.2.1.15. % of changes closed before deadline
6.2.2.1.16. % of routine changes
6.2.2.1.17. % of refused changes by CAB
6.2.2.1.18. Ratio of number of incidents versus number of changes
6.2.2.1.19. Average change closure duration
6.2.2.1.20. % of implemented changes without Impact Analysis
6.2.2.1.21. % of changes that required restoration of backup
6.2.2.1.22. % of time coordinating changes
6.2.2.1.23. Change closure duration rate
6.2.2.1.24. Frequency of CAB meeting
6.2.2.1.25. Average costs of change implementation
6.2.2.1.26. % of Planned vs Unplanned changes
6.2.2.1.27. % of incidents caused by deficient documentation
6.2.2.1.28. Efforts required for impact assessment of an incident, change
6.2.2.1.29. Efforts required for impact assessment of an incident, change
6.2.2.1.30. Number of incidents caused by changes vs total nr of incidents
6.2.2.1.31. % of unregistered changes
6.2.2.1.32. Total rework after implementation of changes
6.2.2.1.33. Average rework per change after implementation of changes
6.2.2.1.34. % of registered RFCs without Test plan
6.2.2.1.35. % of registered RFCs without backout plan
6.2.2.1.36. % of registered RFCs without Implementation Plan
6.2.3. Service Asset and Configuration Management
6.2.3.1. Asset Management KPIs
6.2.3.1.1. % of software licenses used
6.2.3.1.2. Average age of hardware assets
6.2.3.1.3. % of licences purchased and not accounted for in configuration repository
6.2.3.1.4. % of CIs under maintenance contract
6.2.3.1.5. Number of business compliance issues caused by improper configuration of assets
6.2.3.1.6. Percentage of end user computers
6.2.3.1.7. Percentage of end user printers
6.2.3.1.8. Number of deviations between configuration repository and actual configurations
6.2.3.1.9. Hardware asset value
6.2.3.1.10. Software support costs
6.2.3.1.11. Number of Licenses Purchased vs. Available
6.2.3.2. Configuration Management KPIs
6.2.3.2.1. % of CIs monitored for performance
6.2.3.2.2. % of software licenses used
6.2.3.2.3. % of licences purchased and not accounted for in configuration repository
6.2.3.2.4. Average number of components under management per FTE
6.2.3.2.5. % of CIs under maintenance contract
6.2.3.2.6. Average number of versions of software
6.2.3.2.7. % of unauthorized CI's in the IT infrastructure
6.2.3.2.8. % of CIs mapped onto IT services in the CMDB
6.2.3.2.9. Average time period between identifying and rectifying a discrepancy
6.2.3.2.10. Cost of CMDB reconciliation
6.2.3.2.11. Average time between CMDB reconciliation
6.2.3.2.12. Average time spent on CMDB reconciliation
6.2.3.2.13. % of incidents not solved in-time due to inaccurate configuration data
6.2.3.2.14. % of inaccuratly registered CIs in CMDB
6.2.3.2.15. Average audit cycle of CIs
6.2.3.2.16. % of audited CIs
6.2.3.2.17. Incident impact rate incomplete CMDB
6.2.3.2.18. Number of business compliance issues caused by improper configuration of assets
6.2.3.2.19. Number of deviations between configuration repository and actual configurations
6.2.3.2.20. CMDB Data Quality
6.2.3.2.21. Growth of the CMDB
6.2.4. Release and Deployment Management
6.2.4.1. KPIs
6.2.4.1.1. % of successful software upgrades
6.2.4.1.2. Average cycle time between urgent releases
6.2.4.1.3. % of successfull software installations
6.2.4.1.4. Average costs of release
6.2.4.1.5. Percentage of succesful releases
6.2.4.1.6. Percentage of deployed releases that caused incidents
6.2.4.1.7. Percentage of deployments that required a back-out or remediation plan to be actioned
6.2.4.1.8. Average costs of a release
6.2.4.1.9. Number of software defects in production
6.2.4.1.10. Number of untested releases
6.2.4.1.11. Number of urgent releases
6.2.4.1.12. Number of incidents due to the deployment of releases
6.2.4.1.13. Fail rate of tested vs non-tested emergency releases
6.2.5. Knowledge Management
6.2.6. Service Validation and Testing
6.2.7. Change Evaluation
6.3. Service Transition Documentation
6.3.1. Service Transition Strategies, Policies, Plans and Budgets
6.3.2. Service Packages
6.3.3. Service Design Package (SDP)
6.3.4. Service Acceptance Criteria (SAC)
6.3.5. SLAs, Contracts and Agreements
6.3.6. Change and Configuration Management Policy, Plans and Reports
6.3.7. Change Models
6.3.8. Requests for Changes (RFC) and Change Records
6.3.9. Change Schedules and Plans
6.3.10. CAB Agenda & Minutes
6.3.11. Configuration Models
6.3.12. Configuration Baselines, Status Reports and Audit Reports
6.3.13. Release Policies, Plans, Notes, Packages and Documentation
6.3.14. Service Quality Policy, Risk Policy, Test Strategy, Test Models, Test Plans, Test Reports and Known Errors
6.3.15. Build Plans and Documentation
6.3.16. Evaluation Plans & Reports
6.3.17. Deployment Plans and Reports
6.3.18. Service Transition Report
6.3.19. Knowledge Management Strategy
7. Service Strategy
7.1. Added Value
7.1.1. Understand what the strategy is
7.1.2. Clearly define the services and the customers who use these services
7.1.3. Identify existing market opportunities and use them
7.1.4. Predict and plan for the resources required to provide services
7.1.5. Define the quality of services
7.1.6. Determine the appropriate approach to improving services
7.2. Service Strategy Processes (5)
7.2.1. Strategy Management for IT services
7.2.2. Financial Management for IT services
7.2.2.1. managing an IT service provider’s budgeting, accounting and charging requirements.
7.2.2.2. Accounting
7.2.2.3. Budgeting
7.2.2.4. Charging
7.2.2.5. KPIs
7.2.2.5.1. % of budget deviation relative to total budget
7.2.2.5.2. Delay in production of financial reports
7.2.2.5.3. Overall cost of IT delivery per customer
7.2.2.5.4. Average penalty costs per SLA
7.2.2.5.5. % of spent on IT maintenance
7.2.2.5.6. % spent on new IT developments/investments
7.2.2.5.7. Unit costs of IT service(s)
7.2.2.5.8. Net Present Value (NPV) of investment
7.2.2.5.9. Actual vs. budgeted costs
7.2.2.5.10. Return on Investment (ROI)
7.2.2.5.11. Cost-/Benefit estimation %
7.2.2.5.12. Number of budget deviations
7.2.2.5.13. Hardware asset value
7.2.2.5.14. Software support costs
7.2.2.5.15. Forecast accuracy of budget
7.2.2.5.16. Total Cost of Ownership (TCO)
7.2.3. Demand Management
7.2.3.1. Understanding, anticipating and influencing customer demand for services.
7.2.3.2. KPIs
7.2.3.2.1. % of time when Capacity resources are being used below expected
7.2.3.2.2. Capacity plans evaluated
7.2.3.2.3. Number of incidents based on Capacity problems related to Demand Management
7.2.3.2.4. % Deviation average between predicted demand and actual demand
7.2.3.2.5. Average time since Demand Management is triggered to corrective actions are initiated
7.2.3.2.6. Number of times Demand Management is triggered
7.2.3.2.7. Number of times when Demand Management successfully triggered the Capacity Management process
7.2.3.2.8. Number of PBAs analyzed and tracked by the process
7.2.4. Service Portfolio Management
7.2.5. Business Relationship Management
7.2.5.1. Maintaining a positive relationship with customers (business).
7.3. Service Strategy Documentation
7.3.1. Vision and Mission
7.3.2. Strategies: (strategic and tactical)
7.3.3. Plans and Policies
7.3.4. Service Requirements
7.3.5. Service Charter
7.3.6. Service Definitions, classification and visualization
7.3.7. Service Models
7.3.8. Service Packages
7.3.9. Option Space
7.3.10. Cost Model
7.3.11. Financial information and budgets
7.3.12. Business cases
7.3.13. Business Impact Analysis (BIA)
7.3.14. Patterns of Business Activity (PBAs)
7.3.15. User Profiles (UPs)
7.3.16. Stakeholder Definitions