

1. Diagnostic Analytics
1.1. Uses statistical tests to confirm insights...
1.1.1. Data Hygiene
1.1.1.1. Benford's Test
1.1.1.1.1. Theory
1.1.1.1.2. Practice
1.1.2. Confirmatory Statistics
1.1.2.1. Objective
1.1.2.1.1. Answering the question - "is what I see statistically significant?"
1.1.2.2. Approach
1.1.2.2.1. The Tests
1.1.2.2.2. The Experimental Design
1.1.2.3. Practice
1.1.2.3.1. Relationships Between Two Timeseries
1.1.2.3.2. Relationships Between to Sets of Numbers
1.1.2.3.3. Relationships Between Two Categories
1.1.2.3.4. Relationships Between Numbers and Categories
2. Predictive Analytics
2.1. Use insights from the past to inform estimates of the future...
2.1.1. Two Types
2.1.1.1. Forecasting
2.1.1.1.1. Concept
2.1.1.1.2. Practice
2.1.1.2. Regression
2.1.1.2.1. Concept
2.1.1.2.2. Practice
2.1.2. Thinking Deeply
2.1.2.1. Philosophical Considerations
2.1.2.1.1. Level of Trust
2.1.2.1.2. Predict or Prescribe?
2.1.2.2. Prescriptive Analytics
2.1.2.2.1. Concept
2.1.2.2.2. Practice
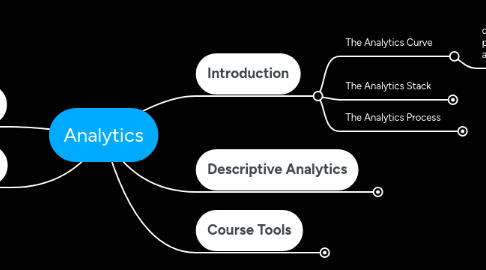
3. Introduction
3.1. The Analytics Curve
3.1.1. data science and analytics are typically presented on a curve of increasing difficulty and value...
3.1.1.1. https://www.energycentral.com/sites/default/files/ec-core/nodes/227281/new_value_curve_-_oct_2015_-_final.jpg
3.2. The Analytics Stack
3.2.1. Categories of Tools
3.2.1.1. The tools of data analytics are categorised by the job they do. In simple terms, jobs can be split into "Access", "Store", "Wrangle", "Compute", and "Consume". But lines are blurred!
3.2.1.1.1. http://mattturck.com/wp-content/uploads/2018/07/Matt_Turck_FirstMark_Big_Data_Landscape_2018_Final.png
3.2.2. Examples of "Data Stacks"
3.2.2.1. These tools must be assembled to run analytics tasks...
3.2.2.1.1. https://academy.vertabelo.com/blog/microsoft-sql-server-pros-and-cons/msbi_overview.png
3.2.2.1.2. https://www.techapeek.com/wp-content/uploads/2019/06/What-Are-Some-Good-Tools-For-Big-Data-Analytics.png
3.2.3. Common Used Tools
3.2.3.1. A subset of tools are commonly used in these stacks...
3.2.3.1.1. https://d2h0cx97tjks2p.cloudfront.net/blogs/wp-content/uploads/sites/2/2019/03/Data-Science-Tools.jpg
3.3. The Analytics Process
3.3.1. CRISP-DM is a useful way of thinking about a data science or analytics challenge. The process and the stacks are strongly aligned...
3.3.1.1. https://www.kdnuggets.com/wp-content/uploads/crisp-dm-4-problems-fig1.png
4. Descriptive Analytics
4.1. Visual analytics dominates the descriptive analytics field. We will focus on two types...
4.1.1. Dashboards
4.1.1.1. Objective
4.1.1.1.1. High density data visualisations enabling exploration, mining, and interpretation of complex datasets...
4.1.1.2. Approach
4.1.1.2.1. Design Process
4.1.1.3. Practice
4.1.1.3.1. Simple Dashboard-Type Visuals
4.1.1.3.2. Challenge
4.1.2. Infographics
4.1.2.1. Objective
4.1.2.1.1. Engaging visuals that communicate clear data messages...
4.1.2.2. Approach
4.1.2.2.1. https://www.youtube.com/watch?v=5Zg-C8AAIGg
4.1.2.2.2. https://en.wikipedia.org/wiki/Edward_Tufte#/media/File:Minard.png
4.1.2.3. Practice
4.1.2.3.1. High Density Insights
4.1.2.3.2. Geographic Presentation
4.1.2.3.3. Getting Something Extra
5. Course Tools
5.1. Datasets
5.1.1. Link
5.1.1.1. http://bit.ly/2mV0lJj
5.2. Test
5.2.1. Link
5.2.1.1. http://bit.ly/2ZrOpBt
5.2.2. Dataset
5.2.2.1. "Test"