1. LINEA DE TIEMPO Esta herramienta del conjunto de Organizadores Gráficos permite ordenar una secuencia de eventos o de hitos sobre un tema, de tal forma que se visualice con claridad la relación temporal entre ellos.
2. MAPA DE IDEAS Es una forma de organizar visualmente las ideas que permite establecer relaciones no jerárquicas entre diferentes ideas.
3. TELARAÑAS Las telarañas son mapas visuales que muestran cómo ciertas categorías de información se relacionan con otras.
3.1. Training
3.2. Channels
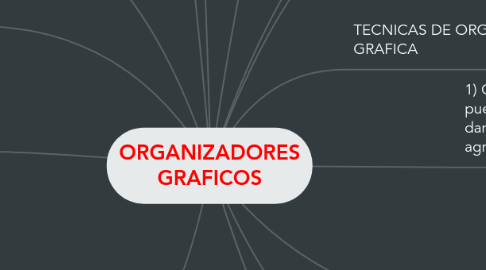
3.3. International
3.4. Public Sector
3.5. Sales
3.6. Marketing Communications
3.7. Product Management
4. MAPA CONCEPTUAL Los mapas conceptuales, son una técnica que cada día se utiliza más en los diferentes niveles educativos, desde preescolar hasta la universidad, en informes hasta en tesis de investigación, utilizados como técnica de estudio hasta herramienta para el aprendizaje, ya que permite al docente ir construyendo con sus alumnos y explorar en estos los conocimientos previos
5. Los Organizadores Gráficos toman formas físicas diferentes y cada una de ellas resulta apropiada para representar un tipo particular de información.
6. TIPO DE ORGANIZADORES
7. 4) Identificar conceptos erróneos. Al tiempo que un mapa conceptual u otro Organizador Gráfica muestre lo que los estudiantes saben, los enlaces mal dirigidos o conexiones erradas, dejan al descubierto lo que ellos no han comprendido aún.
7.1. Sales Strategy
7.1.1. Direct Sales Strategy
7.1.2. Inside Sales Strategy
7.1.3. Channel Sales Strategy
7.2. Partner Strategy
7.2.1. Channel Strategy
7.2.1.1. What 3rd party channels should we consider for reselling this service?
7.2.2. Technology Partnerships
7.2.2.1. What technology vendors (if any) do we need to work with to execute on this plan?
7.2.3. Solutions Partners
8. 3) Integrar nuevos conocimientos. Los diagramas actualizados durante toda una lección incitan a los estudiantes a construir sobre su conocimiento previo y a integrar la nueva información
8.1. Revenue Forecasts
8.1.1. Revenue and P&L Forecast (5 Years)
8.1.2. Revenue should be split out quarterly
8.2. Cost Analysis
8.2.1. Should include a description of the costs in entering this business and profitability analysis
8.3. Profitability Analysis
8.3.1. P&L for the offer to include gross margin, net income and break even analysis.
9. 2) Reforzar la comprensión. Los estudiantes reproducen en sus propias palabras lo que han entendido. Esto les ayuda a absorber e interiorizar nueva información, dándoles posesión sobre sus propias ideas.
9.1. Service Offer
9.1.1. What are we selling?
9.1.2. Product Definition
9.1.3. Pricing
9.1.4. Packaging
9.1.5. Positioning
9.2. Value Proposition
9.2.1. What is the Value Proposition to the Customer?
9.2.2. What pain are we solving?
10. Los Organizadores Gráficos son verdaderamente unas muy útiles estrategias para conseguir que los estudiantes se hagan cargo de su aprendizaje puesto que incluyen tanto palabras como imágenes visuales, siendo así efectivos para diferentes alumnos, desde aquellos estudiantes talentosos hasta los que tienen dificultades de aprendizaje.
11. 1) Clarificar el pensamiento. Los estudiantes pueden ver cómo se conectan las ideas y se dan cuenta de cómo se puede organizar o agrupar la información.
11.1. Situational Analysis / Drivers
11.1.1. What is driving us to do this?
11.1.2. SWOT Analysis
11.1.2.1. Strengths
11.1.2.2. Weaknesses
11.1.2.3. Opportunities
11.1.2.4. Threats
11.1.3. Customer Findings - What have we learned from customers?
11.2. Competitive Analysis
11.2.1. Do we have competitors and threats in these target markets with the proposed offerings?
11.2.2. What are our competitors doing and how are they positioning?
11.2.3. How do we position against each competitor?
11.3. Target Customer(s)
11.3.1. Buyer Profile
11.3.1.1. Title
11.3.1.2. Industry
11.3.1.3. Geography
11.3.1.4. Business Size
11.3.2. Influencer Profile
11.3.3. User Profile
11.3.4. What do customers want and need?
11.3.5. What business problems do each of these customers have?
11.4. Customer Segmentation
11.4.1. Which customers or sets of customers do we sell to?
11.4.2. What are the target market segments that we want to go after?
11.4.3. What are the distinct problems for each segment of the market?
11.5. Total Available Market
11.5.1. New Prospects
11.5.1.1. How much of each target segment have we penetrated?
11.5.1.2. How much opportunity is available in each target segment?
11.5.2. Existing Customers
11.5.2.1. Can we up-sell existing customers?
12. Los Organizadores Gráficos nos sirven de mucha utilidad, ya que nos ayudan a enfocar lo que es importante porque resaltan conceptos y vocabulario que son claves,
13. UTILIDAD
14. TECNICAS DE ORGANIZACION GRAFICA
14.1. Go-To-Market Strategy
14.1.1. Positioning & Messaging
14.1.1.1. What is the key messaging and positioning for the service offer? (Pain, alternatives, solution)
14.1.1.2. How do we communicate internally?
14.1.1.3. How do we communicate externally?
14.1.2. Promotion Strategy
14.1.2.1. Marketing Programs (Installed base versus new prospects)
14.1.2.2. Advertising (Publications, etc.)
14.1.2.3. Analyst Relations (Target Analysts)
14.1.2.4. Public Relations
14.1.2.5. Events (Trade shows, SEO/SEA, Seminars)
14.1.2.6. Webinars
14.1.3. Demand Generation & Lead Qualification
14.1.3.1. How do we generate and qualify new leads for the target offer?
14.1.3.2. Prospect Lists
14.1.3.3. Key Questions to Ask
14.1.3.4. Sales Collateral
14.1.3.5. Presentations
14.1.3.6. Data Sheets
14.1.3.7. White Papers
14.1.3.8. ROI Tools
14.1.3.9. Other Sales Tools (web site, etc.)
14.2. Measure and Improve
14.2.1. Numbers, budget, waterfall, break-even (cost>leads>trials>deals)
14.2.2. Sales Programs
14.2.3. Accelerated Learning Strategy, Controls, Metrics
14.2.4. Include feedback loops
14.2.5. Include financial metrics (definition of success)
14.2.6. Pipeline reports, etc…
14.3. Other Considerations
14.3.1. M&A?
14.3.2. Risk Analysis & Mitigation
