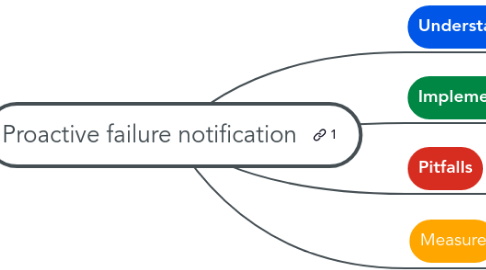
1. Pitfalls
1.1. Alert only when broken
1.1.1. too late
1.2. Noisy or numerous alerts leading the miss relevant alert
1.2.1. e.g. rule: one false posivite max by week (or day)
1.2.2. Anti-pattern: "cause-based alerting"
1.2.2.1. aka The montoring solution try to
1.2.2.1.1. enumarate all possible error conditions
1.2.2.1.2. write an alert for each of them
1.2.2.2. leading to
1.2.2.2.1. very bad Signal Noise Ratio SNR
1.2.2.2.2. pager fatigue
1.2.2.3. Recomended pattern
1.2.2.3.1. "Symptom based alerting"
1.3. Unadapted metric aligment
1.3.1. Alignment means: within time series regularization
1.3.1.1. raw time serie
1.3.1.2. aligned on small window
1.3.1.3. aligned on larger window
1.3.2. Window (aka duration)
1.3.2.1. Example: Sampling 1 min, Align period=5min, aligner=SUM, condition= GREATER then 2, assume eval every 1 min
1.3.3. Function
1.3.3.1. e,g, Aligner
1.3.3.1.1. ALIN_MIN ALIGN_MAX ALIGN_MEAN ALIGN_COUNT ALIGN_SUM
1.3.3.1.2. ALIGN_PERCENTILE_99 ALIGN_PERCENTILE_95 ALIGN_PERCENTILE_50 ALIGN_PERCENTILE_05
1.3.3.1.3. ALIGN_NONE ALIGN_DELTA ALIGN_RATE ALIGN_INTERPOLATE ALIGN_NEXT_OLDER ALIGN-STDEV ALIGN_COUNT_TRUE ALIGN_COUNT_FALSE ALIGN_FRACTION_TRUE ALIGN_PERCENT_CHANGE
1.3.4. Summary
1.3.4.1. Larger alignment windows means more metrice samples -> more stability
1.3.4.2. Samller alignment windows means les metric samples -> more sensibility
1.4. Unadapted condition duration window
1.4.1. Start firing with a first measurement maching condition while should wait to confirm
1.4.1.1. Example: Sampling 1 min, Align period=5min, aligner=SUM, condition= GREATER then 2, assume eval every 1 min AND duration 3 min
1.4.2. Summary
1.4.2.1. Larger duration means less noisy and longer to alert
1.4.2.2. Smaler duration means short alerting and potentially more false positives
1.4.2.3. Possible to set duration = 0 -> single aligned result will trigger
1.5. Partial metric data
1.5.1. Missing data for more thant the duration -> unknown state
1.5.1.1. no alerts
1.5.1.2. incident not closing
1.5.2. Chosse what to do on missing
1.5.2.1. Nothing
1.5.2.2. treat as violate
1.5.2.3. teat as don't violate
1.5.3. Increase duration as cost of responsiveness
1.6. Unadapted notification latency
1.6.1. Metric sampling delay
1.6.1.1. E.g. Sampled every 60 seconds. After sampling, data is not visible for up to 180 seconds
1.6.2. Alerting computation delay
1.6.2.1. E.g.cloud monitoring: 60 to 90 sec
1.6.3. Duration window
1.6.3.1. E.g. 3 minutes
1.6.4. Time to deliver notification
1.6.4.1. E.g. 3 min
1.6.5. Time for operator to Ack the Alert
1.6.5.1. e.g. 15 min
1.6.6. E.g. Total = 3 + 1.5 + 3 + 15 = 22.5 min
1.6.6.1. + impact of the aligment window: last hours vs last 24 hours
2. Measure
2.1. % of incident where not detected through monitoring-alerting
2.2. Number of false positive alert per week for a given team-product
2.3. % of acknowledged alerts on agreed time
2.4. % of unactionable alerts
2.5. % of silenced alerts
2.6. Distribution of alerts on hours and team locations
3. Understand
3.1. Fix issue before it start impacting users
3.2. Anti-pattern
3.2.1. Customer reported issue
4. Implement
4.1. Use alerting rules
4.1.1. e.g. Prometheus Alert Manager
4.1.2. e.g. Cloud Monitoring Alerting Policies
4.2. Identify related monitoring metric
4.2.1. Built in
4.2.1.1. e.g. loadbalancing.googleapis.com/https/request_count
4.2.1.1.1. Url map filtering to specific feature
4.2.1.1.2. Error reate based on response_code filtering
4.2.2. Log based
4.2.2.1. e.g logging.googleapis.com/user/ram_latency_e2e
4.2.2.1.1. Distribution of duration values
4.2.2.1.2. Enable to detect when the system is getting to slow
4.2.3. Custom
4.2.3.1. Any specific measurement directly implemented in the App Code
4.2.4. Sercice Level
4.2.4.1. e.g. Error budget burn rate
4.2.4.1.1. sli_measurement = good_events_count / (good_events_count + bad_events_count), for a given aggregation window slo = the target e.g. 99.9% error_budget_target = 100% - slo, e.g. 0.1% error_budget_measurement = 100% - sli_measurement error_budget_burn_rate = error_budget_measurement / error_budget_target example one: 0.08% / 0.1% = 0.8 burnrate example two: 0.15% / 0.1% = 1.5 burnrate
4.3. Define the metric computation
4.3.1. Right duration windows to query a given metric
4.3.1.1. e.g. CPU higher 80% for at least 5 minutes
4.3.2. Aggregation
4.3.2.1. e.g resource group
4.3.3. Calculation
4.3.3.1. None
4.3.3.1.1. e,g, number of process running on a VM instance is more than, or less than, a threshold
4.3.3.2. Rate-of-change
4.3.3.2.1. Values in a time series increase or decrease by a specific percent
4.3.3.3. Metric-ratio
4.3.3.3.1. E.g. error rate: Good / (Good + Bad)
4.4. Set conditions to define when to alert
4.4.1. One of multiple
4.4.2. Use thresholds to define Early warning indicators
4.4.2.1. aka. look to trends before it is too late
4.4.3. E.g.
4.4.3.1. Alerting on burn rate
4.4.3.2. Remaining capacity or quotas
4.5. Check how often is evaluated the rule
4.5.1. Configurable
4.5.1.1. e.g. Prometheus alerting manager / rule group interval setting
4.5.1.2. Contribute to the End to End detection time
4.5.1.3. Reduce un necessary load on the monitorig back end
4.5.2. Fixed
4.5.2.1. e.g. Cloud Monitoring Alerting policy "Alerting policy conditions are evaluated at a fixed frequency." "Alerting policy computations take an additional delay of 60 to 90 seconds"
4.6. Use adapted notification channel
4.6.1. How fast the response should be ?
4.6.1.1. Bad New should travel fast
4.6.1.2. e.g.
4.6.1.2.1. email
4.6.1.2.2. pager dutty
4.6.1.2.3. slack
4.6.2. Where are the skills to deal with the detected issue?
4.6.2.1. Who can better limit the potential blast radius?
4.6.2.1.1. e.g dedicated SRE team 24x7
4.6.2.1.2. Opportunity to improve the service / go to root cause
4.6.2.1.3. Skill economy
4.6.2.2. Anti partten
4.6.2.2.1. Common NOC, SOC, outsourced offshore
4.6.2.2.2. e.g: L0 reboot the VM and keep as is
4.6.2.2.3. Scale economy
