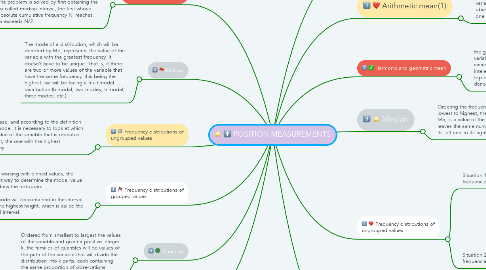
1. Grouped frequency distributions
1.1. This case is of less interest, since currently it is not usual to work with grouped data, given that computing allows a lot of information to be handled without the need to lose part of it in groupings. The problem is solved by first obtaining the so-called median interval, the first whose absolute cumulative frequency Ni reaches or exceeds N/2.
2. Fashion
2.1. The mode of a distribution, which will be denoted by Mo, represents the value of the variable with the greatest frequency. It doesn't have to be unique. That is, if there are two or more values of the variable that have the same frequency, this being the highest, we will be facing a multimodal distribution (bimodal, two modes; trimodal, three modes; etc.).
3. Frequency distributions of ungrouped values
3.1. In this case, and according to the definition of the mode, it is necessary to look at which is the value of the variable that is repeated the most, the one with the highest frequency.
3.1.1. Example 2.10 15 students have been asked about the number of weekly hours devoted to study, collecting their responses in the following frequency distribution.
3.1.1.1. Solution The mode is 5 (Mo = 5), since it is the value of the variable with the highest frequency. A total of 8 students spend 5 hours studying.
4. Frequency distributions of grouped values
4.1. When working with binned values, the easiest way to determine the modal value is to draw the histogram. The mode will be contained in the interval with the highest height, which is called the modal interval.
5. Quantiles
5.1. Ordered from smallest to largest the values of the variable and given a positive integer k, the families of quantiles will be values of the path of the variable that will divide the distribution into k parts, each containing the same proportion of observations
6. realizado por madeleine jaime pabon
7. In general, position measures indicate a value of the variable around which a group of observations are situated. It can be distinguished between:
7.1. a) Measures of central tendency: arithmetic mean, harmonic mean, geometric mean, median and mode. b) Measures of non-central tendency: quantiles.
8. Arithmetic mean(1)
8.1. It is the sum of all the values of the variable divided by the total number of observations. It is denoted by one dimensional data analysis
8.1.1. Obviously, this measure can only be calculated if the statistical variable under study is quantitative in nature. The value that the mean takes must always be included between the minimum and maximum value of the domain of the analyzed variable.
9. Harmonic and geometric mean
9.1. the geometric mean, which is used when the variables are of a multiplicative nature in the sense, for example, that interest generates new interest or when the wage increase is made on top of the previous one and not on a fixed one, is denoted by Mg and is defined like: 2,3,5/ 6,8,9
10. Median
10.1. Ordering the frequency distribution from lowest to highest, the median, denoted by Me, is a value of the path of the variable that leaves the same number of observations to its left and to its right.
11. Frequency distributions of ungrouped values
11.1. Situation 1. Distribution of unit frequencies
11.1.1. If the number of observations is odd, the median value will coincide with the value xi (Me = xi) that leaves the same number of observations on the right and left. If the number of observations is even, then the median value will be obtained as the mean of the value(4)
11.2. Situation 2. Distribution of non-unit frequencies
11.2.1. To calculate the median it is necessary to distinguish between frequency distributions of ungrouped and grouped values, but the idea that must always be kept in mind is that the median is that value of the variable to which a cumulative frequency equal to N/2 corresponds.
11.2.2. When the frequency distribution is not unitary, the following criterion is usually used to determine the value of the median: let Ni be the first accumulated absolute frequency equal to or greater than N/2
